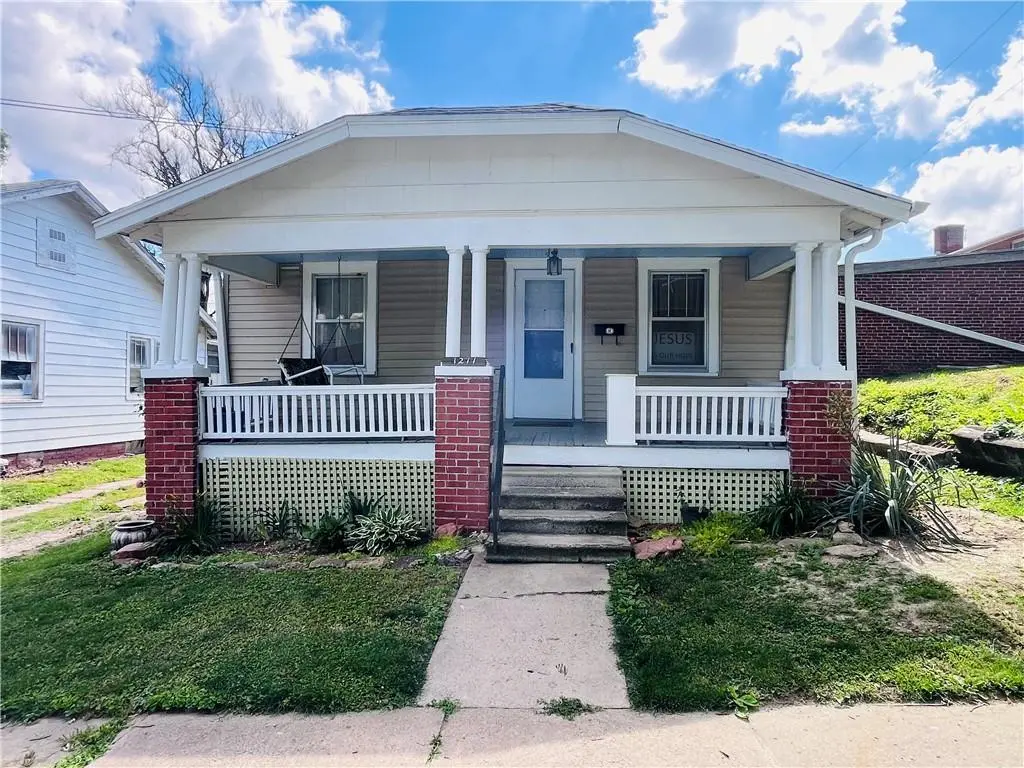
1211 S 25th St
St. Joseph, MO 64507
$80,000C-
1 bd · 1.0 ba ·
676 sqft ·
Built 1922
· SingleFamily
· Active
· 23 DOM
Cashflow @ list (25.0% down · 7.5%)
Estimated rent
$681/mo
Mortgage (P&I)
−$420
Tax + insurance
−$70
HOA
−$0
Vac / Maint / Mgmt
−$143
Net cashflow
$48/mo
Annual
$580/yr
Cap rate
7.02%
Cash-on-cash
2.59%
DSCR
1.12
1% rule
0.85%
Cash to close
$22,400
Investor read
- This is a 1-bed/1.0-bath single-family listed at $80k.
- At list price, monthly cash flow is $48 ($580/yr) — positive.
- The deal already cash-flows at list — no discount required.
- To meet the 1% rule (rent ≥ 1% of price), the offer needs to be $68k (14.9% below list).
- It's been on market 23 days — a 2% lower offer ($79k) is reasonable based on typical stale-listing flexibility.
- Recommended offer: $68k (14.9% below list) — sets the bar for 1% rule.
- Local home prices are declining (-3.0%/yr); year-one equity from $553 of loan paydown is wiped out by about $2k of value loss. Plan a longer hold.
- Location reads: area grade C — affects rentability + tenant quality, not the cash-flow math above.
- St. Joseph (urban): math 28% / reading 38% proficiency, ranked #241 of 324 in MO (top 74%) — families likely to look elsewhere, expect single-tenant / working-renter base with shorter leases.
- Zoned schools: Carden Park Elem (math 34% / reading 34%, grade F, #739 of 1,115 statewide, top 67%, 577 students, 100% FRL); Central High (math 28% / reading 50%, grade F, #287 of 521 statewide, top 55%, 1,728 students, 40% FRL) — zoned schools average 70% FRL vs 53% district-wide (17 pts higher); higher-poverty schools than district average — tighter screening recommended.
- Watch-outs: built in 1922 — expect roof / HVAC / electrical / plumbing capex.
- Market conditions: 96 active listings in the ZIP; 15 comparable units currently listed for rent nearby; rentals lingering (median 45d on market — plan ~5-8 weeks vacancy on turnover, expect pricing pressure); 100% of comp listings sitting > 30 days — soft ceiling on asking rent; 70 units permitted in Buchanan County in 2024 (0 in 5+ unit buildings).
- Buchanan County population projected to shrink 6% by 2050 — rents likely to lag national; underwrite the cash flow, not the appreciation.
- Cap rate 7.0% vs local median 4.7% in St. Joseph — top-decile yield for the area; either an underpriced asset or a hidden risk that comps aren't pricing in. Stress-test before assuming the spread holds.
Questions for listing agent
- Built in 1922 — when were the roof, HVAC, electrical panel, plumbing, and water heater last replaced?
- Is there a deadline driving the sale (1031 exchange, divorce, estate, relocation)? That informs how much negotiation room exists.
- What's the average days-on-market for RENTAL listings here right now (not sales)? A rising rental-DOM trend means longer vacancies and softer asking-rent achievability than the comps imply.
- What's the recent tenant-quality profile in this submarket — average credit score on applications, eviction rate, late-payment / NSF rate, and stable-employment percentage? A property-management company in the area should have these aggregated.
- How much new for-sale + rental construction is in the pipeline within 1–3 miles? Heavy new supply typically softens prices + rents 12–24 months out; constrained supply supports both.
CashFlowRE · CFR-C9BRBYFRMEQMWG
· Data 1 day ago
cashflowre.app · 2026-05-29