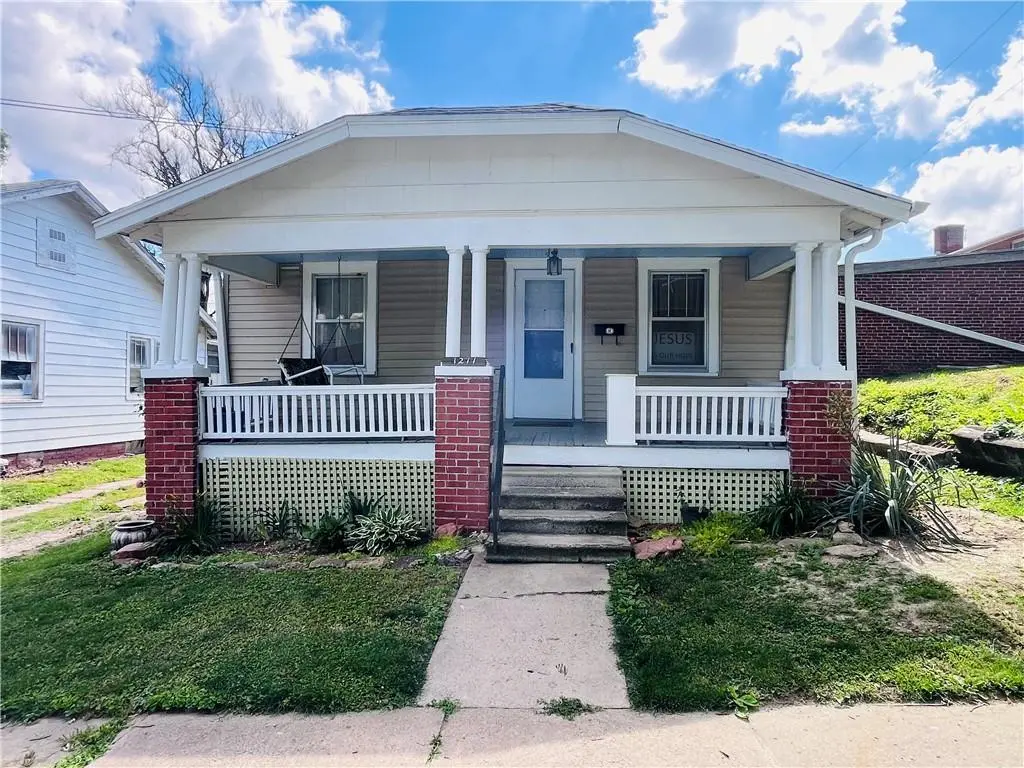
1211 S 25th St · St. Joseph, MO
Flood risk 4/10 · Minor
- FEMA flood zone
- X
- Chance of flooding over 30 yrs
- 0.22%
- Est. flood insurance / yr
- $473 – $860
Fire risk 1/10 · Minimal
- Est. fire insurance / yr
- $1,054 – $1,958
Heat risk 4/10 · Minor
- Hot days now (above 106°F)
- 7 days/yr
- Hot days in 30 yrs
- 16 days/yr
Wind risk 2/10 · Minimal
- Chance of severe wind over 30 yrs
- —
Air-quality risk 2/10 · Minimal
- Unhealthy air days now
- 1 days/yr
- Unhealthy air days in 30 yrs
- 1 days/yr
Risk factors via First Street. Map © Google.
Why this score? — see what drove the C- grade
The composite is a weighted blend of 9 inputs, each scored 0–100. Each bar is that input's sub-score; the figure is the points it added to the 100-point composite (weight × sub-score).
- Cash flow +16.6/30.0
- ARV discount +15.0/15.0
- DSCR +5.2/10.0
- 1% rule +3.5/10.0
- Schools +2.8/10.0
- Rent growth +2.5/5.0
- Livability +2.5/5.0
- Condition / age +2.5/5.0
- Appreciation +0.0/10.0
$80,000
🖨 Deal sheet (PDF) 📄 Offer letter ✓ Due diligence
Listing remarks
Charming 1 bedroom 1 bathroom main floor laundry bungalow full of character. This cozy home features original hardwood floors, a spacious covered front porch with swing, and classic wood trim throughout. Enjoy comfortable living with an inviting layout and timeless appeal. Perfect for a first-time homebuyer, investor or anyone looking to downsize. Conveniently located with easy access to local amenities, shopping and dining. Don't miss the opportunity to own this affordable and charming home!
Key facts
- Covered front porch
- Wood trim
- Main floor laundry
Tags
Property features AI
Finance
- Other: Lot is publicly maintained; Lot size recorded as 4,356 square feet
- HOA & community: No association fees
Exterior
- Parking: Shared driveway
- Utilities: Public water; Public sewer
- Home design: Single-family residence; Bungalow floor plan
- Construction: Brick and vinyl siding exterior; Composition roof; Has basement
- Exterior features: Porch; Shed(s); Paved road access; Located within city limits; Not in a flood plain
Interior
- Kitchen: Refrigerator; Gas range
- Bedrooms: 1 bedroom (Main level)
- Flooring: Wood floors
- Bathrooms: 1 full bathroom (Main level)
- Heating & cooling: Natural gas heating; Electric cooling
- Interior features: Formal dining area; Unfinished basement
- Laundry & utility: Laundry area off the kitchen
Neighborhood map
What this means for you Summary
Snapshot
- This is a 1-bed/1.0-bath single-family listed at $80k.
Deal economics
- At list price, monthly cash flow is $48 ($580/yr) — positive.
- The deal already cash-flows at list — no discount required.
- To meet the 1% rule (rent ≥ 1% of price), the offer needs to be $68k (14.9% below list).
- Recommended offer: $68k (14.9% below list) — sets the bar for 1% rule.
- Cap rate 7.0% vs local median 4.7% in St. Joseph — top-decile yield for the area; either an underpriced asset or a hidden risk that comps aren't pricing in. Stress-test before assuming the spread holds.
Location & tenants
- Location reads: area grade C — affects rentability + tenant quality, not the cash-flow math above.
- St. Joseph (urban): math 28% / reading 38% proficiency, ranked #241 of 324 in MO (top 74%) — families likely to look elsewhere, expect single-tenant / working-renter base with shorter leases.
- Zoned schools: Carden Park Elem (math 34% / reading 34%, grade F, #739 of 1,115 statewide, top 67%, 577 students, 100% FRL); Central High (math 28% / reading 50%, grade F, #287 of 521 statewide, top 55%, 1,728 students, 40% FRL) — zoned schools average 70% FRL vs 53% district-wide (17 pts higher); higher-poverty schools than district average — tighter screening recommended.
- Market conditions: 95 active listings in the ZIP; 15 comparable units currently listed for rent nearby; rentals lingering (median 44d on market — plan ~5-8 weeks vacancy on turnover, expect pricing pressure); 100% of comp listings sitting > 30 days — soft ceiling on asking rent; 70 units permitted in Buchanan County in 2024 (0 in 5+ unit buildings).
Forward outlook
- Local home prices are declining (-3.0%/yr); year-one equity from $553 of loan paydown is wiped out by about $2k of value loss. Plan a longer hold.
- Buchanan County population projected to shrink 6% by 2050 — rents likely to lag national; underwrite the cash flow, not the appreciation.
Negotiation context
- It's been on market 23 days — a 2% lower offer ($79k) is reasonable based on typical stale-listing flexibility.
Risks & watch-outs
- Watch-outs: built in 1922 — expect roof / HVAC / electrical / plumbing capex.
Questions for the listing agent
- Built in 1922 — when were the roof, HVAC, electrical panel, plumbing, and water heater last replaced?
- Is there a deadline driving the sale (1031 exchange, divorce, estate, relocation)? That informs how much negotiation room exists.
- What's the average days-on-market for RENTAL listings here right now (not sales)? A rising rental-DOM trend means longer vacancies and softer asking-rent achievability than the comps imply.
- What's the recent tenant-quality profile in this submarket — average credit score on applications, eviction rate, late-payment / NSF rate, and stable-employment percentage? A property-management company in the area should have these aggregated.
- How much new for-sale + rental construction is in the pipeline within 1–3 miles? Heavy new supply typically softens prices + rents 12–24 months out; constrained supply supports both.
Investment metrics
- 1% rule
- 0.85% ✗
- Cap rate
- 7.02%
- Cash-on-cash
- 2.59%
- DSCR
- 1.12
- GRM
- 9.8
CMA / ARV
- ARV (on-the-fly)
- $99,372
- Comps found
- 7
Show comp detail 7 sales within ~0.75 mi
| Address | Dist | Beds/Ba | Sqft | Sold | Price | $/sf | Match |
|---|---|---|---|---|---|---|---|
| 2327 Seneca St | 0.15mi | 2/1.0 (+1) | 700 (+4%) | 20mo | $115,000 | $164 | 65 |
| 2907 Penn St | 0.45mi | 2/1.0 (+1) | 678 (+0%) | 13mo | $99,500 | $147 | 63 |
| 717 S 17th St | 0.62mi | 2/1.0 (+1) | 716 (+6%) | 3mo | $114,500 | $160 | 54 |
| 519 S 19th St | 0.62mi | 2/1.0 (+1) | 696 (+3%) | 12mo | $52,900 | $76 | 51 |
| 2206 Monterey Dr | 0.31mi | 2/1.0 (+1) | 768 (+14%) | 23mo | $124,900 | $163 | 39 |
| 1823 S 24th St | 0.41mi | 2/1.0 (+1) | 775 (+15%) | 24mo | $100,000 | $129 | 31 |
| 2207 Vories St | 0.53mi | 2/1.0 (+1) | 768 (+14%) | 20mo | $84,900 | $111 | 31 |
Match score weights: distance 35% · size 25% · config 20% · recency 20%. Top-matched comps best support the ARV.
Projected returns pro-forma
-3.0% appreciation · 3.0% rent growth · sell at horizon
- IRR
- -12.2%
- Equity multiple
- 0.56×
- Total profit
- $-9,912
- Equity at exit
- $11,928
- IRR
- -3.2%
- Equity multiple
- 0.79×
- Total profit
- $-4,782
- Equity at exit
- $6,917
Cash invested: $22,400 (down + closing). Projections, not guarantees.
Landlord ↔ Tenant lean methodology
- Overall (STATE)
- 81 Strongly Landlord-Friendly
- State Missouri
- 81 Strongly Landlord-Friendly · R+10
- County
- — inherits STATE
- City
- — inherits STATE
ZIP-level market 64507
- Active inventory
- 95
- Price-to-rent
- 9.8×
Monthly cashflow live
- Estimated rent
- $681 high interval (Pro) →
- Mortgage (P&I)
- −$420
- Tax from tax record
- −$37 /mo · $438/yr
- Insurance
- −$33
- HOA
- −$0
- Vacancy / Maint / Mgmt
- −$143
- Net cashflow
- $48
Break-even live
Sensitivity live
| Price | -10% $94 | -5% $71 | +0% $48 | +5% $26 | +10% $3 |
|---|---|---|---|---|---|
| Rent | -10% $-5 | -5% $21 | +0% $48 | +5% $75 | +10% $102 |
| Rate | -1.0pp $89 | -0.5pp $69 | base $48 | +0.5pp $28 | +1.0pp $7 |
UW: 25.0% down · 7.5% · 30yr · 1.5% tax · 5.0% vac · 8.0% maint · 8.0% mgmt
Financing live
Cash to close
- Down payment
- $20,000
- Closing costs
- $2,400
- Reserves months
- —
- Total cash needed
- —
Loan-product check · same deal, 3 products live
Conventional
25% down · 7.5% · 30yr
- Down + closing
- —
- Monthly P&I
- —
- Monthly cashflow
- —
- DSCR
- —
- Eligible?
- —
Personal DTI + credit; lowest rate.
DSCR
20% down · 8.5% · 30yr
- Down + closing
- —
- Monthly P&I
- —
- Monthly cashflow
- —
- DSCR
- —
- Eligible?
- —
No personal income docs; deal must DSCR.
Hard money
10% down · 12.0% · 12mo
- Down + closing
- —
- Monthly P&I
- —
- Monthly cashflow
- —
- DSCR
- —
- Eligible?
- —
Short-term bridge; refi at stabilization.
Rent comps 15 comps
| Address | Beds | Baths | Sqft | Rent | $/sqft | DOM | Units | Dist |
|---|---|---|---|---|---|---|---|---|
| 2509 Duncan St Unit 308 St Joseph, MO | — | 1.0 | 440 | $730 | $1.66 | 44d | 1 | 0.28mi |
| 826 S 14th St Saint Joseph, MO | — | 1.0 | 500 | $589 | $1.18 | 44d | 1 | 0.76mi |
| 1106 Olive St Saint Joseph, MO | 2.0 | 1.0 | 700 | $725 | $1.04 | 44d | 1 | 0.90mi |
| 1300 S 11th St Apt 640 St Joseph, MO | — | 1.0 | 438 | $672 | $1.53 | 44d | 1 | 0.91mi |
| 1300 S 11th St Apt 646 St Joseph, MO | — | 1.0 | 417 | $578 | $1.39 | 44d | 1 | 0.91mi |
| 1300 S 11th St Saint Joseph, MO | — | 1.0 | 417 | $625 | $1.50 | 44d | 1 | 0.91mi |
| 1300 S 11th St Apt 445 St Joseph, MO | — | 1.0 | 417 | $616 | $1.48 | 44d | 1 | 0.91mi |
| 1300 S 11th St Apt 644 St Joseph, MO | — | 1.0 | 417 | $595 | $1.43 | 44d | 1 | 0.91mi |
| 1300 S 11th St Unit 642 St Joseph, MO | — | 1.0 | 417 | $589 | $1.41 | 44d | 1 | 0.91mi |
| 1300 S 11th St Unit 038 St Joseph, MO | — | 1.0 | 485 | $718 | $1.48 | 44d | 1 | 0.91mi |
| 312 N Noyes Blvd Saint Joseph, MO | — | 1.0 | 550 | $600 | $1.09 | 44d | 1 | 0.92mi |
| 201 S 10th St Saint Joseph, MO | 2.0 | 1.0 | 600 | $828 | $1.38 | 44d | 1 | 1.15mi |
| 1015 Faraon St St Joseph, MO | 1.0 | 1.0 | 743 | $820 | $1.10 | 44d | 1 | 1.29mi |
| 425 N 11th St Unit 104 St Joseph, MO | 1.0 | 1.0 | 400 | $750 | $1.88 | 44d | 1 | 1.30mi |
| 516 N 10th St Saint Joseph, MO | 1.0–2.0 | 1.0 | 700 | $685 | $0.98 | 44d | 1 | 1.42mi |
Listing history 18 events
-
2026-06-19days on market $80,000 Active 23 DOM
-
2026-06-18days on market $80,000 Active 22 DOM
-
2026-06-17days on market $80,000 Active 21 DOM
-
2026-06-16days on market $80,000 Active 20 DOM
-
2026-06-15days on market $80,000 Active 19 DOM
-
2026-06-14days on market $80,000 Active 17 DOM
-
2026-06-12days on market $80,000 Active 16 DOM
-
2026-06-09days on market $80,000 Active 13 DOM
-
2026-06-09price $80,000 Active 12 DOM
-
2026-06-08days on market $90,000 Active 12 DOM
-
2026-06-07days on market $90,000 Active 11 DOM
-
2026-06-03days on market $90,000 Active 7 DOM
-
2026-06-02days on market $90,000 Active 6 DOM
-
2026-06-01pricedays on market $90,000 Active 5 DOM
-
2026-05-31days on market $99,000 Active 4 DOM
-
2026-05-30days on market $99,000 Active 3 DOM
-
2026-05-27$99,000 Active
-
1996-12-09soldstatus
ⓘ Source: listings_history table (triggers on properties + properties_extension) + one-shot
backfill from property_details.listing_events for pre-trigger history.
Tax reassessment forecast MO · Resets to sale price
- Current annual tax
- $438 · $37/mo
- Projected year-2 tax
- $776 · $65/mo
- Expected delta
- +$338/yr (+$28/mo · 77.2%)
ⓘ Screening estimate from a state-policy table — verify with the county assessor before closing.
Climate risk First Street
- Flood 4/10 Moderate FEMA zone X · 22% chance over 30 yrs
- Wildfire 1/10 Low
- Heat 4/10 Moderate 7 d/yr ≥106°F today · 16 d/yr by 30 yrs out
- Wind 2/10 Low
- Air quality 2/10 Low 1 unhealthy d/yr today · 1 by 30 yrs out
Nearby sold comps map
Loading sold comps map…
Walkable amenities ~0.75 mi
Loading nearby amenities…
Taxation est. · year 1
- Rental income
- $8,168
- − Mortgage interest
- −$4,481
- − Property taxes
- −$438
- − Insurance
- −$400
- − Repairs & maintenance
- −$653
- − Management
- −$653
- − Depreciation
- −$2,327
- Taxable loss
- −$785
- Est. tax savings @ 24.0%
- +$189
- After-tax cash flow
- $769/yr
For passive investors: Depreciation is non-cash, so a rental often shows a tax loss while cash-flowing — sheltering income. Rental losses are passive: they offset passive income freely, and up to $25,000/yr can offset ordinary (W-2) income if you actively participate and your MAGI is under $100k (phasing out to $0 by $150k); unused losses carry forward. On sale, claimed depreciation is recaptured at up to 25%, and gains may owe capital-gains tax (a 1031 exchange can defer both). Figures are a year-1 estimate at your 24.0% rate — not tax advice; consult a CPA.
Schools (NCES district)
- District
- St. Joseph
- NCES district ID
- 2927060
- Math proficiency
- 28% ▼ -6.00%
- Reading proficiency
- 38% ▼ -1.00%
- Median HH income
- $43,007
- Composite
- 27.99/100
- National rank
- #6853
- State rank
- #241 of 324 in MO
Livability — St. Joseph
No livability data for this city. (Only ~50 U.S. cities are tracked.)
Census & demographics
- Census place
- St. Joseph, MO
- City population
- 44,382
- Population (ZIP)
- 14,159
Population outlook (Buchanan County) Hauer SSP2
- Today (2025)
- 89,041 people
- By 2030
- 88,401 · -0.7%
- By 2040
- 86,220 · -3.2%
- By 2050
- 83,603 · -6.1%
- By 2075
- 76,750 · -13.8%
- By 2100
- 67,623 · -24.1%
Race, ethnicity, and origin ACS 2023
- Neighborhood character
- Predominantly White (81%)
- Race & ethnicity
- White 81% Black 8% Two or more races 7% Hispanic / Latino 5%
- Hispanic origin (detail)
- Mexican 2% Puerto Rican 2%
- Common ancestry
- Slovak 2% Lithuanian 2% Romanian 2%
- Foreign-born
- 2% · Canada
- Languages at home
- 97% English-only · Spanish 2% French/Haitian/Cajun 1%
Political lean MEDSL · Buchanan
- 2024 margin
- Strong R (+28.0) · D 35.2% · R 63.3% · Other 1.5%
- 2008→2024 swing
- -28.2pp toward R · 2008: 0.1pp · 2024: -28.0pp
- All cycles
- 2024: R+28.0 2020: R+24.6 2016: R+26.2 2012: R+8.7 2008: D+0.1
Not yet ingested
- Civics
- —
Market trends
- HPI YoY
- ▼ -121.49%
- Current HPI
- 165.1511
- Rent YoY
- —
- Metro
- —
- State GDP YoY
- ▲ 1.84%
- F500 in state
- 20
Industry mix (Fortune 500 HQ in MO)
| Industry | F500 HQs | Revenue |
|---|---|---|
| Healthcare | 1 | $163B |
|
||
| Insurance | 1 | $21B |
|
||
| Industrial Technology | 1 | $17B |
|
||
| Retail | 1 | $16B |
|
||
| Industrial Distribution | 1 | $10B |
|
||
| Utilities | 1 | $9B |
|
||
Price history
2 events — show timeline
- 2026-05-27 Listed $99,000 Heartland MLS as Distributed by MLS Grid
- 1996-12-09 Sold (Public Records) — Public Records
Property tax history
+1.5%/yrLatest (2025): $438 · +5.7% YoY. Source: county tax records.
Cash-flow waterfall
monthlySold comps — $/sqft
last 12 mo · ≤1 miLoading sold comps…