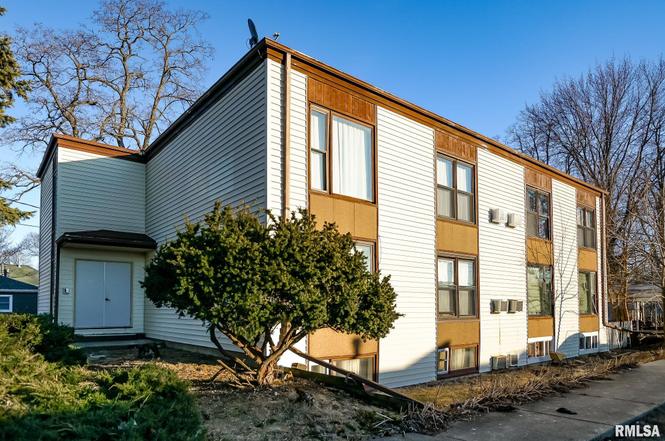
1312 E Wilson Ave
Peoria, IL 61603
$699,900B-
22 bd · 22.0 ba ·
10,176 sqft ·
Built 1968
· MultiFamily
· Pending
· 34 DOM
Cashflow @ list (25.0% down · 7.5%)
Estimated rent
$11,572/mo
Mortgage (P&I)
−$3,670
Tax + insurance
−$1,166
HOA
−$0
Vac / Maint / Mgmt
−$2,430
Net cashflow
$4,305/mo
Annual
$51,660/yr
Cap rate
13.67%
Cash-on-cash
26.36%
DSCR
2.17
1% rule
1.65%
Cash to close
$195,972
Investor read
- This is a 11 × 2-bed/2.0-bath units multifamily listed at $700k.
- At list price, monthly cash flow is $4k ($52k/yr) — positive. Per door: $391/mo.
- The deal already cash-flows at list — no discount required.
- Meets the 1% rule at list price ($12k rent vs $700k).
- It's been on market 34 days — a 3% lower offer ($679k) is reasonable based on typical stale-listing flexibility.
- Recommended offer: $679k (3.0% below list) — sets the bar for market timing.
- Local home prices are declining (-3.0%/yr); year-one equity from $5k of loan paydown is wiped out by about $21k of value loss. Plan a longer hold.
- Location reads 73/100 on livability (#270 in IL) — a middle-class / working-renter tenant base. Strengths: commute A+, cost of living A+, housing A+; Watch: employment D+, crime F.
- Peoria SD 150 (urban): math 11% / reading 14% proficiency, ranked #554 of 620 in IL (top 89%) — low school quality limits family demand, transient renter base, plan for 1-2y turnover; 70% free/reduced lunch — lower-income household profile, screen leases tightly.
- Zoned schools: Peoria High School (math 4% / reading 7%, grade F, #609 of 693 statewide, top 88%, 1,447 students, 0% FRL) — zoned schools average 0% FRL vs 70% district-wide (70 pts lower); this property's tenant base skews higher-income than the district average.
- Market conditions: Rents rising (+3.5%/yr); 104 active listings in the ZIP; lower-income renter base — watch delinquency; 73 units permitted in Peoria County in 2024 (0 in 5+ unit buildings).
- Peoria County population projected at -11% by 2050 — secular population decline; favor cash flow + early exit over multi-decade hold.
- 5 sale attempts since 3y ago with the ask held roughly flat each time — persistent listings suggest the price (not the market) is what's stuck; bring a comps-based counter.
- At projected returns (-3.0% appreciation + 3.5% rent growth), your $196k cash investment doubles in ~5 years — after that, you're playing with house money.
- Cap rate 13.7% vs local median 5.6% in Peoria — top-decile yield for the area; either an underpriced asset or a hidden risk that comps aren't pricing in. Stress-test before assuming the spread holds.
- At $11,572/mo this rent would consume 334% of the median local household income ($42k/yr) (locally 849% of renters already pay >50% of income on rent) — very limited rent-growth headroom before tenants either downsize or default.
Questions for listing agent
- It's been on market 34 days. Have you received any prior offers? Is the seller open to a 3% concession, seller financing, or rate buy-down credit?
- Can we see the unit-by-unit rent roll, current vacancy, and any below-market leases? What's the average tenancy length?
- What capital expenditures (roof, boiler, parking lot, exteriors) have been made in the last 5 years, and what's planned in the next 2?
- Built in 1968 — when were the roof, HVAC, electrical panel, plumbing, and water heater last replaced?
- Is there a deadline driving the sale (1031 exchange, divorce, estate, relocation)? That informs how much negotiation room exists.
- Schools are F-rated, which usually means shorter tenancies and higher turnover. Who's the typical renter profile here, and what's been the actual vacancy rate?
- Crime grade is F in this area — have there been break-ins, vandalism, or insurance claims at this property in the last 3 years? What carrier currently insures it and at what premium?
- What's the average days-on-market for RENTAL listings here right now (not sales)? A rising rental-DOM trend means longer vacancies and softer asking-rent achievability than the comps imply.
CashFlowRE · CFR-C9EDYSEJMAP2F4
· Data 3 weeks ago
cashflowre.app · 2026-05-29