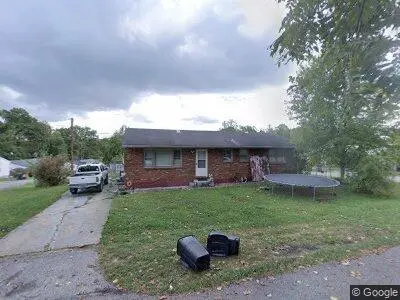
901 Mary Sue Dr
Flatwoods, KY 41139
$140,000D-
3 bd · 1.0 ba ·
1,248 sqft ·
Built 1970
· SingleFamily
· Active
· 41 DOM
Cashflow @ list (25.0% down · 7.5%)
Estimated rent
$1,115/mo
Mortgage (P&I)
−$734
Tax + insurance
−$179
HOA
−$0
Vac / Maint / Mgmt
−$234
Net cashflow
$-32/mo
Annual
$-380/yr
Cap rate
6.02%
Cash-on-cash
-0.97%
DSCR
0.96
1% rule
0.80%
Cash to close
$39,200
Investor read
- This is a 3-bed/1.0-bath single-family listed at $140k.
- At list price, monthly cash flow is $-32 ($-380/yr) — negative.
- To cash-flow at today's rent, offer at most $134k (4.0% below list).
- To meet the 1% rule (rent ≥ 1% of price), the offer needs to be $112k (20.3% below list).
- It's been on market 41 days — a 3% lower offer ($136k) is reasonable based on typical stale-listing flexibility.
- Recommended offer: $112k (20.3% below list) — sets the bar for 1% rule.
- Local home prices are declining (-3.0%/yr); year-one equity from $968 of loan paydown is wiped out by about $4k of value loss. Plan a longer hold.
- Location reads 72/100 on livability (#125 in KY) — a middle-class / working-renter tenant base. Strengths: crime A+, cost of living A+, housing A+; Watch: amenities F, commute F.
- Russell Independent (suburban): math 40% / reading 49% proficiency, ranked #22 of 165 in KY (top 13%) — families likely to look elsewhere, expect single-tenant / working-renter base with shorter leases.
- Zoned schools: Russell Primary School (486 students, 53% FRL); Russell Middle School (math 37% / reading 52%, grade D, #36 of 217 statewide, top 18%, 511 students, 44% FRL); Russell High School (math 42% / reading 47%, grade F, #21 of 254 statewide, top 10%, 668 students, 42% FRL).
- Market conditions: 42 active listings in the ZIP; 20 units permitted in Greenup County in 2024 (0 in 5+ unit buildings).
- Greenup County population projected at -19% by 2050 — secular population decline; favor cash flow + early exit over multi-decade hold.
- 3 sale attempts since 10y ago with the ask held roughly flat each time — persistent listings suggest the price (not the market) is what's stuck; bring a comps-based counter.
- Current owner paid $90k; list at $140k implies a 56% gain — meaningful room to come down on a strong offer.
- Cap rate 6.0% vs local median 3.7% in Flatwoods — top-decile yield for the area; either an underpriced asset or a hidden risk that comps aren't pricing in. Stress-test before assuming the spread holds.
Questions for listing agent
- What do current leases actually rent for vs. the listed asking? Can we see a recent rent roll and the last 12 months of T-12 income?
- It's been on market 41 days. Have you received any prior offers? Is the seller open to a 20% concession, seller financing, or rate buy-down credit?
- Built in 1970 — when were the roof, HVAC, electrical panel, plumbing, and water heater last replaced?
- Is there a deadline driving the sale (1031 exchange, divorce, estate, relocation)? That informs how much negotiation room exists.
- Schools are B-rated — typically a magnet for longer-tenancy family renters. What's the average tenant stay here, and is there a school-zone premium baked into asking?
- The area grade is low — what's the realistic commute time and amenity access for the typical tenant pool here? Any planned neighborhood developments (good or bad) we should know about?
- What's the average days-on-market for RENTAL listings here right now (not sales)? A rising rental-DOM trend means longer vacancies and softer asking-rent achievability than the comps imply.
- What's the recent tenant-quality profile in this submarket — average credit score on applications, eviction rate, late-payment / NSF rate, and stable-employment percentage? A property-management company in the area should have these aggregated.
CashFlowRE · CFR-CB4JV78P7HNSTP
· Data 3 h ago
cashflowre.app · 2026-05-29