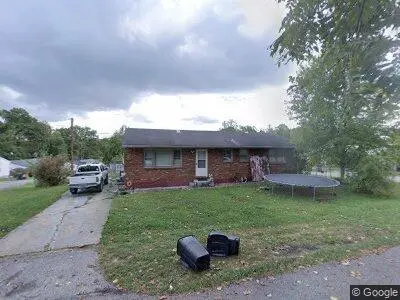
901 Mary Sue Dr · Flatwoods, KY
Flood risk 1/10 · Minimal
- FEMA flood zone
- —
- Chance of flooding over 30 yrs
- 0.0%
- Est. flood insurance / yr
- —
Fire risk 4/10 · Minor
- Est. fire insurance / yr
- $839 – $1,559
Heat risk 4/10 · Minor
- Hot days now (above 102°F)
- 7 days/yr
- Hot days in 30 yrs
- 19 days/yr
Wind risk 2/10 · Minimal
- Chance of severe wind over 30 yrs
- 2.0%
Air-quality risk 2/10 · Minimal
- Unhealthy air days now
- 0 days/yr
- Unhealthy air days in 30 yrs
- 2 days/yr
Risk factors via First Street. Map © Google.
Why this score? — see what drove the D- grade
The composite is a weighted blend of 9 inputs, each scored 0–100. Each bar is that input's sub-score; the figure is the points it added to the 100-point composite (weight × sub-score).
- Cash flow +12.1/30.0
- ARV discount +8.2/15.0
- Schools +3.8/10.0
- DSCR +3.6/10.0
- Livability +3.6/5.0
- 1% rule +3.0/10.0
- Rent growth +2.5/5.0
- Condition / age +2.5/5.0
- Appreciation +0.0/10.0
$140,000
🖨 Deal sheet (PDF) 📄 Offer letter ✓ Due diligence
Listing remarks MLS
brick ranch on corner lot in desirable Russell School District. Newer rear deck and freshly stained, New handicap ramp that could easily be removed. Partial fenced rear yard. Newer flooring throughout. Update appliances remain with house. Nicely landscaped. Please call for private showing.
Key facts
- Quiet neighborhood
- Corner lot
- Built 1970
Tags
Neighborhood map
What this means for you Summary
Snapshot
- This is a 3-bed/1.0-bath single-family listed at $140k.
Deal economics
- At list price, monthly cash flow is $-32 ($-380/yr) — negative.
- To cash-flow at today's rent, offer at most $134k (4.0% below list).
- To meet the 1% rule (rent ≥ 1% of price), the offer needs to be $112k (20.3% below list).
- Recommended offer: $112k (20.3% below list) — sets the bar for 1% rule.
- Cap rate 6.0% vs local median 3.7% in Flatwoods — top-decile yield for the area; either an underpriced asset or a hidden risk that comps aren't pricing in. Stress-test before assuming the spread holds.
Location & tenants
- Location reads 72/100 on livability (#125 in KY) — a middle-class / working-renter tenant base. Strengths: crime A+, cost of living A+, housing A+; Watch: amenities F, commute F.
- Russell Independent (suburban): math 40% / reading 49% proficiency, ranked #22 of 165 in KY (top 13%) — families likely to look elsewhere, expect single-tenant / working-renter base with shorter leases.
- Zoned schools: Russell Primary School (486 students, 53% FRL); Russell Middle School (math 37% / reading 52%, grade D, #36 of 217 statewide, top 18%, 511 students, 44% FRL); Russell High School (math 42% / reading 47%, grade F, #21 of 254 statewide, top 10%, 668 students, 42% FRL).
- Market conditions: 42 active listings in the ZIP; 20 units permitted in Greenup County in 2024 (0 in 5+ unit buildings).
Forward outlook
- Local home prices are declining (-3.0%/yr); year-one equity from $968 of loan paydown is wiped out by about $4k of value loss. Plan a longer hold.
- Greenup County population projected at -19% by 2050 — secular population decline; favor cash flow + early exit over multi-decade hold.
Negotiation context
- It's been on market 40 days — a 3% lower offer ($136k) is reasonable based on typical stale-listing flexibility.
- 3 sale attempts since 10y ago with the ask held roughly flat each time — persistent listings suggest the price (not the market) is what's stuck; bring a comps-based counter.
- Current owner paid $90k; list at $140k implies a 56% gain — meaningful room to come down on a strong offer.
Questions for the listing agent
- What do current leases actually rent for vs. the listed asking? Can we see a recent rent roll and the last 12 months of T-12 income?
- It's been on market 40 days. Have you received any prior offers? Is the seller open to a 20% concession, seller financing, or rate buy-down credit?
- Built in 1970 — when were the roof, HVAC, electrical panel, plumbing, and water heater last replaced?
- Is there a deadline driving the sale (1031 exchange, divorce, estate, relocation)? That informs how much negotiation room exists.
- Schools are B-rated — typically a magnet for longer-tenancy family renters. What's the average tenant stay here, and is there a school-zone premium baked into asking?
- The area grade is low — what's the realistic commute time and amenity access for the typical tenant pool here? Any planned neighborhood developments (good or bad) we should know about?
- What's the average days-on-market for RENTAL listings here right now (not sales)? A rising rental-DOM trend means longer vacancies and softer asking-rent achievability than the comps imply.
- What's the recent tenant-quality profile in this submarket — average credit score on applications, eviction rate, late-payment / NSF rate, and stable-employment percentage? A property-management company in the area should have these aggregated.
- How much new for-sale + rental construction is in the pipeline within 1–3 miles? Heavy new supply typically softens prices + rents 12–24 months out; constrained supply supports both.
Investment metrics
- 1% rule
- 0.80% ✗
- Cap rate
- 6.02%
- Cash-on-cash
- -0.97%
- DSCR
- 0.96
- GRM
- 10.5
CMA / ARV
- ARV (on-the-fly)
- $142,272
- Comps found
- 12
Show comp detail 12 sales within ~0.75 mi
| Address | Dist | Beds/Ba | Sqft | Sold | Price | $/sf | Match |
|---|---|---|---|---|---|---|---|
| 1000 Powell Lane Ln | 0.18mi | 3/1.0 | 1,242 (-0%) | 2mo | $144,500 | $116 | 89 |
| 917 Diedrich Dr | 0.05mi | 3/1.0 | 1,152 (-8%) | 1mo | $175,000 | $152 | 84 |
| 1907 Diedrich Dr | 0.11mi | 3/1.5 | 1,352 (+8%) | 6mo | $175,000 | $129 | 74 |
| 2106 Washington St | 0.22mi | 3/2.0 | 1,340 (+7%) | 3mo | $150,000 | $112 | 71 |
| 1310 Argillite Rd | 0.41mi | 3/1.0 | 1,312 (+5%) | 2mo | $140,499 | $107 | 70 |
| 610 Lagar Street St | 0.47mi | 3/1.5 | 1,215 (-3%) | 5mo | $138,000 | $114 | 67 |
| 1600 Beth Ann Drive Dr | 0.56mi | 3/1.0 | 1,270 (+2%) | 5mo | $168,000 | $132 | 67 |
| 1907 Washington St | 0.10mi | 3/1.0 | 1,065 (-15%) | 6mo | $162,400 | $152 | 65 |
| 1919 Washington Street St | 0.26mi | 3/2.0 | 1,120 (-10%) | 2mo | $115,000 | $103 | 65 |
| 823 Cumberland Ave Ave | 0.48mi | 3/2.0 | 1,162 (-7%) | 7mo | $64,500 | $56 | 56 |
| 1215 W Collins St | 0.68mi | 2/1.5 (-1) | 1,200 (-4%) | 2mo | $118,000 | $98 | 53 |
| 2000 Espy Ln | 0.41mi | 3/2.0 | 1,420 (+14%) | 7mo | $143,000 | $101 | 48 |
Match score weights: distance 35% · size 25% · config 20% · recency 20%. Top-matched comps best support the ARV.
Projected returns pro-forma
-3.0% appreciation · 3.0% rent growth · sell at horizon
- IRR
- -17.9%
- Equity multiple
- 0.37×
- Total profit
- $-24,721
- Equity at exit
- $20,874
- IRR
- -10.1%
- Equity multiple
- 0.38×
- Total profit
- $-24,193
- Equity at exit
- $12,105
Cash invested: $39,200 (down + closing). Projections, not guarantees.
Landlord ↔ Tenant lean methodology
- Overall (STATE)
- 83 Strongly Landlord-Friendly
- State Kentucky
- 83 Strongly Landlord-Friendly · R+16
- County
- — inherits STATE
- City
- — inherits STATE
ZIP-level market 41139
- Home prices YoY
- -6.4%
- Active inventory
- 42
- Price-to-rent
- 10.5×
Monthly cashflow live
- Estimated rent
- $1,115 medium interval (Pro) →
- Mortgage (P&I)
- −$734
- Tax from tax record
- −$120 /mo · $1,444/yr
- Insurance
- −$58
- HOA
- −$0
- Vacancy / Maint / Mgmt
- −$234
- Net cashflow
- $-32
Break-even live
Sensitivity live
| Price | -10% $48 | -5% $8 | +0% $-32 | +5% $-71 | +10% $-111 |
|---|---|---|---|---|---|
| Rent | -10% $-120 | -5% $-76 | +0% $-32 | +5% $12 | +10% $56 |
| Rate | -1.0pp $39 | -0.5pp $4 | base $-32 | +0.5pp $-68 | +1.0pp $-105 |
UW: 25.0% down · 7.5% · 30yr · 1.5% tax · 5.0% vac · 8.0% maint · 8.0% mgmt
Financing live
Cash to close
- Down payment
- $35,000
- Closing costs
- $4,200
- Reserves months
- —
- Total cash needed
- —
Loan-product check · same deal, 3 products live
Conventional
25% down · 7.5% · 30yr
- Down + closing
- —
- Monthly P&I
- —
- Monthly cashflow
- —
- DSCR
- —
- Eligible?
- —
Personal DTI + credit; lowest rate.
DSCR
20% down · 8.5% · 30yr
- Down + closing
- —
- Monthly P&I
- —
- Monthly cashflow
- —
- DSCR
- —
- Eligible?
- —
No personal income docs; deal must DSCR.
Hard money
10% down · 12.0% · 12mo
- Down + closing
- —
- Monthly P&I
- —
- Monthly cashflow
- —
- DSCR
- —
- Eligible?
- —
Short-term bridge; refi at stabilization.
Listing history 24 events
-
2026-06-21days on market $140,000 Active 40 DOM
-
2026-06-21days on market $140,000 Active 39 DOM
-
2026-06-18days on market $140,000 Active 37 DOM
-
2026-06-17days on market $140,000 Active 36 DOM
-
2026-06-16days on market $140,000 Active 35 DOM
-
2026-06-15days on market $140,000 Active 34 DOM
-
2026-06-13days on market $140,000 Active 32 DOM
-
2026-06-12days on market $140,000 Active 31 DOM
-
2026-06-09days on market $140,000 Active 28 DOM
-
2026-06-08days on market $140,000 Active 27 DOM
-
2026-06-07days on market $140,000 Active 26 DOM
-
2026-06-07days on market $140,000 Active 25 DOM
-
2026-06-04days on market $140,000 Active 22 DOM
-
2026-06-02days on market $140,000 Active 21 DOM
-
2026-06-01days on market $140,000 Active 20 DOM
-
2026-05-31days on market $140,000 Active 19 DOM
-
2026-05-31days on market $140,000 Active 18 DOM
-
2026-05-12$140,000 Active 156-char remark
-
2020-10-26soldstatus $89,500
-
2020-10-19soldstatus $89,500 290-char remark
Show marketing remark (290 chars)
brick ranch on corner lot in desirable Russell School District. Newer rear deck and freshly stained, New handicap ramp that could easily be removed. Partial fenced rear yard. Newer flooring throughout. Update appliances remain with house. Nicely landscaped. Please call for private showing.
-
2020-07-18$94,900 290-char remark
Show marketing remark (290 chars)
brick ranch on corner lot in desirable Russell School District. Newer rear deck and freshly stained, New handicap ramp that could easily be removed. Partial fenced rear yard. Newer flooring throughout. Update appliances remain with house. Nicely landscaped. Please call for private showing.
-
2016-10-06soldstatus $60,000
Show marketing remark (416 chars)
Great starter home with fenced in backyard. This ranch brick is on a corner lot and from the moment you step inside you will feel at home. The eat-in kitchen has a sliding glass door to the deck, large laundry closet and pantry. There are closets galore! This is a great house at a great price! Call today for your private viewing. * Being sold “AS IS”. Will consider selling furnishings with the home. *
-
2016-07-07$69,900
Show marketing remark (416 chars)
Great starter home with fenced in backyard. This ranch brick is on a corner lot and from the moment you step inside you will feel at home. The eat-in kitchen has a sliding glass door to the deck, large laundry closet and pantry. There are closets galore! This is a great house at a great price! Call today for your private viewing. * Being sold “AS IS”. Will consider selling furnishings with the home. *
ⓘ Source: listings_history table (triggers on properties + properties_extension) + one-shot
backfill from property_details.listing_events for pre-trigger history.
Tax reassessment forecast KY · Resets to sale price
- Current annual tax
- $1,444 · $120/mo
- Projected year-2 tax
- $1,444 · $120/mo
- Expected delta
- $0/yr ($0/mo · 0.0%)
ⓘ Screening estimate from a state-policy table — verify with the county assessor before closing.
Climate risk First Street
- Flood 1/10 Low 0% chance over 30 yrs
- Wildfire 4/10 Moderate
- Heat 4/10 Moderate 7 d/yr ≥102°F today · 19 d/yr by 30 yrs out
- Wind 2/10 Low 2% chance of damaging wind over 30 yrs
- Air quality 2/10 Low 0 unhealthy d/yr today · 2 by 30 yrs out
Nearby sold comps map
Loading sold comps map…
Walkable amenities ~0.75 mi
Loading nearby amenities…
Taxation est. · year 1
- Rental income
- $13,384
- − Mortgage interest
- −$7,842
- − Property taxes
- −$1,444
- − Insurance
- −$700
- − Repairs & maintenance
- −$1,071
- − Management
- −$1,071
- − Depreciation
- −$4,073
- Taxable loss
- −$2,816
- Est. tax savings @ 24.0%
- +$676
- After-tax cash flow
- $296/yr
For passive investors: Depreciation is non-cash, so a rental often shows a tax loss while cash-flowing — sheltering income. Rental losses are passive: they offset passive income freely, and up to $25,000/yr can offset ordinary (W-2) income if you actively participate and your MAGI is under $100k (phasing out to $0 by $150k); unused losses carry forward. On sale, claimed depreciation is recaptured at up to 25%, and gains may owe capital-gains tax (a 1031 exchange can defer both). Figures are a year-1 estimate at your 24.0% rate — not tax advice; consult a CPA.
Schools (NCES district)
- District
- Russell Independent
- NCES district ID
- 2105130
- Math proficiency
- 40% ▼ -22.00%
- Reading proficiency
- 49% ▼ -18.00%
- Median HH income
- $49,382
- Composite
- 38.14/100
- National rank
- #4268
- State rank
- #22 of 165 in KY
Livability — Flatwoods
- Score
- 72/100
- State rank
- #125
- US rank
- #5872
Category grades
Schools grade is shown separately in the Schools card above.
Census & demographics
- Census place
- Flatwoods, KY
- County
- Greenup · 24,497 people
- City population
- 5,527
- Metro
- Huntington-Ashland, WV-KY-OH
- Population (ZIP)
- 8,258
- Household income
- $59,550
- Rent vs Own
- Severe rent burden
- 4.4
Population outlook (Greenup County) Hauer SSP2
- Today (2025)
- 34,374 people
- By 2030
- 33,145 · -3.6%
- By 2040
- 30,407 · -11.5%
- By 2050
- 27,702 · -19.4%
- By 2075
- 21,970 · -36.1%
- By 2100
- 16,670 · -51.5%
Race, ethnicity, and origin ACS 2023
- Neighborhood character
- Predominantly White (96%)
- Race & ethnicity
- White 96% Two or more races 3% Hispanic / Latino 1%
- Common ancestry
- Slovak 2% Serbian 1% Lithuanian 1%
- Foreign-born
- 1% · Canada
- Languages at home
- 99% English-only · Spanish 1%
Political lean MEDSL · Greenup
- 2024 margin
- Solid R (+50.5) · D 24.1% · R 74.6% · Other 1.3%
- 2008→2024 swing
- -36.4pp toward R · 2008: -14.1pp · 2024: -50.5pp
- All cycles
- 2024: R+50.5 2020: R+45.1 2016: R+45.5 2012: R+18.6 2008: R+14.1
Not yet ingested
- Civics
- —
Market trends
- HPI YoY
- ▼ -12.89%
- Current HPI
- 189.3977
- Rent YoY
- —
- Metro
- —
- State GDP YoY
- ▲ 1.81%
- F500 in state
- 4
Industry mix (Fortune 500 HQ in KY)
| Industry | F500 HQs | Revenue |
|---|---|---|
| Healthcare | 1 | $118B |
|
||
| Food / Beverage | 1 | $7B |
|
||
Price history
+100.3% since first listed7 events — show timeline
- 2026-05-12 Listed $140,000 FSBO.com
- 2020-10-26 Sold (Public Records) $89,500 Public Records
- 2020-10-19 Sold (MLS) $89,500 AABOR
- 2020-07-18 Listed $94,900 AABOR
- 2016-10-06 Sold (Public Records) $60,000 Public Records
- 2016-10-06 Sold (MLS) $60,000 AABOR
- 2016-07-07 Listed $69,900 AABOR
Property tax history
+7.6%/yrLatest (2025): $1,444 · +2.0% YoY. Source: county tax records.
Cash-flow waterfall
monthlySold comps — $/sqft
last 12 mo · ≤1 miLoading sold comps…