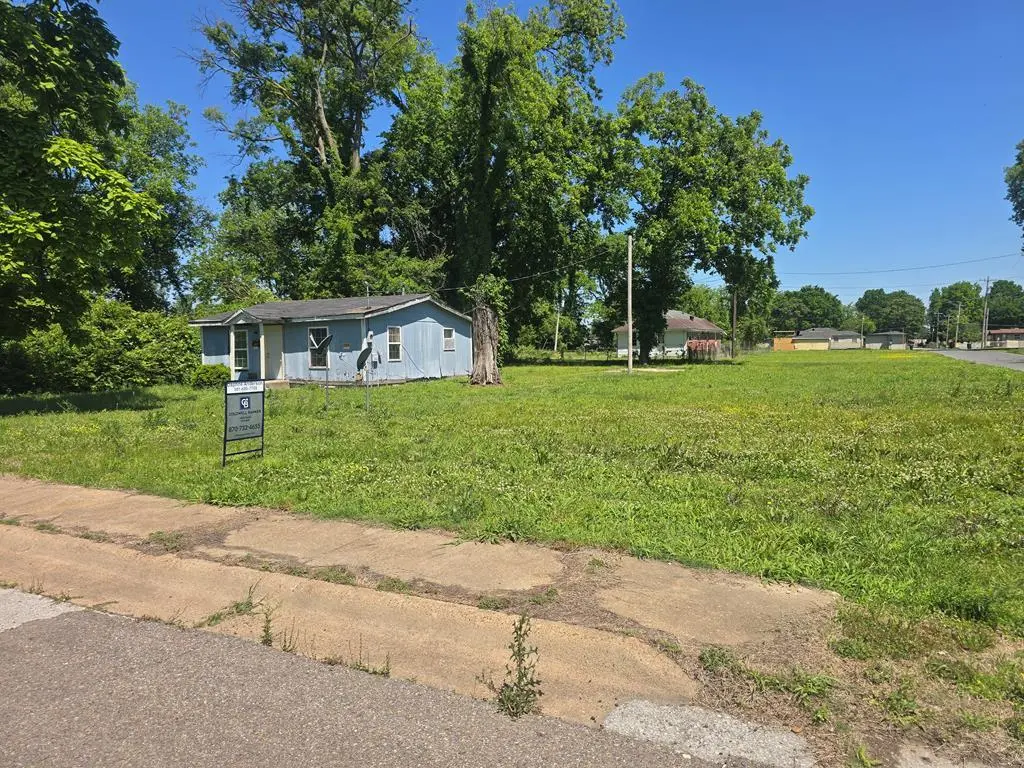
117 E Quinn Ave
Osceola, AR 72370
$10,995D+
2 bd · 1.0 ba ·
676 sqft ·
Built 1978
· SingleFamily
· Active
· 29 DOM
Cashflow @ list (25.0% down · 7.5%)
Estimated rent
$814/mo
Mortgage (P&I)
−$58
Tax + insurance
−$12
HOA
−$0
Vac / Maint / Mgmt
−$171
Net cashflow
$574/mo
Annual
$6,887/yr
Cap rate
68.93%
Cash-on-cash
223.69%
DSCR
10.95
1% rule
7.40%
Cash to close
$3,079
Investor read
- This is a 2-bed/1.0-bath single-family listed at $11k.
- At list price, monthly cash flow is $574 ($7k/yr) — positive.
- The deal already cash-flows at list — no discount required.
- Meets the 1% rule at list price ($814 rent vs $11k).
- It's been on market 29 days — a 2% lower offer ($11k) is reasonable based on typical stale-listing flexibility.
- Recommended offer: $11k (1.5% below list) — sets the bar for market timing.
- In year one you build about $2 of equity ($76 loan paydown + $-74 appreciation (-0.7% local appreciation)).
- Location reads 61/100 on livability (#238 in AR) — a middle-class / working-renter tenant base. Strengths: cost of living A+, housing A+; Watch: crime F, amenities F, commute F.
- Osceola School District (town): math 10% / reading 13% proficiency, ranked #231 of 238 in AR (top 97%) — low school quality limits family demand, transient renter base, plan for 1-2y turnover; 93% free/reduced lunch — lower-income household profile, screen leases tightly.
- Zoned schools: Osceola Elementary School (math 17% / reading 12%, grade F, #408 of 454 statewide, top 91%, 307 students, 99% FRL); Osceola Middle School (math 9% / reading 14%, grade F, #190 of 201 statewide, top 95%, 245 students, 99% FRL); Osceola High School (math 8% / reading 12%, grade F, #276 of 292 statewide, top 96%, 271 students, 99% FRL).
- Market conditions: 29 active listings in the ZIP; 69 units permitted in Mississippi County in 2024 (0 in 5+ unit buildings).
- Mississippi County population projected at -30% by 2050 — secular population decline; favor cash flow + early exit over multi-decade hold.
- 3 sale attempts with the ask held roughly flat each time — persistent listings suggest the price (not the market) is what's stuck; bring a comps-based counter.
- Current owner paid $6k; list at $11k implies a 100% gain — meaningful room to come down on a strong offer.
- At projected returns (-0.7% appreciation + 3.0% rent growth), your $3k cash investment doubles in ~1 year — after that, you're playing with house money.
- Climate carrying-cost: extreme-heat days projected 7→22/yr by 2055 (HVAC capex compounding) — expect insurance premiums to compound above CPI over the hold.
Questions for listing agent
- Built in 1978 — when were the roof, HVAC, electrical panel, plumbing, and water heater last replaced?
- Is there a deadline driving the sale (1031 exchange, divorce, estate, relocation)? That informs how much negotiation room exists.
- Schools are F-rated, which usually means shorter tenancies and higher turnover. Who's the typical renter profile here, and what's been the actual vacancy rate?
- Crime grade is F in this area — have there been break-ins, vandalism, or insurance claims at this property in the last 3 years? What carrier currently insures it and at what premium?
- The area grade is low — what's the realistic commute time and amenity access for the typical tenant pool here? Any planned neighborhood developments (good or bad) we should know about?
- What's the average days-on-market for RENTAL listings here right now (not sales)? A rising rental-DOM trend means longer vacancies and softer asking-rent achievability than the comps imply.
- What's the recent tenant-quality profile in this submarket — average credit score on applications, eviction rate, late-payment / NSF rate, and stable-employment percentage? A property-management company in the area should have these aggregated.
- How much new for-sale + rental construction is in the pipeline within 1–3 miles? Heavy new supply typically softens prices + rents 12–24 months out; constrained supply supports both.
CashFlowRE · CFR-CBM0AAAVMQ9AFH
· Data 1 day ago
cashflowre.app · 2026-05-29