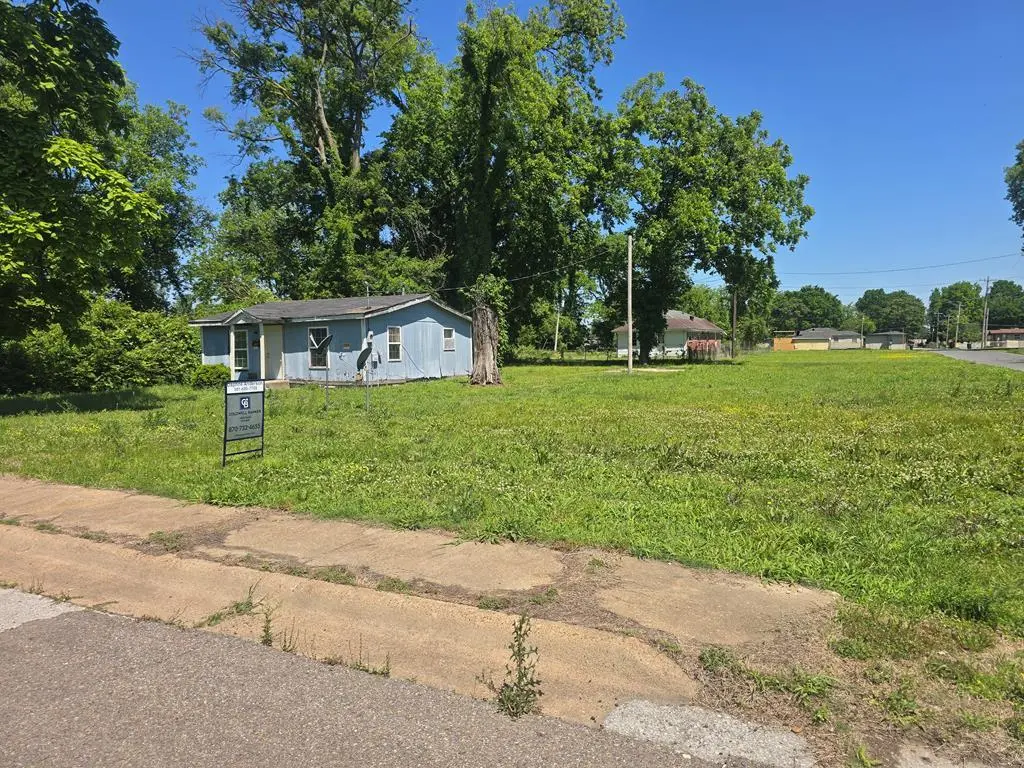
117 E Quinn Ave · Osceola, AR
Flood risk 4/10 · Minor
- FEMA flood zone
- X (shaded)
- Chance of flooding over 30 yrs
- 0.24%
- Est. flood insurance / yr
- $507 – $1,088
Fire risk 1/10 · Minimal
- Est. fire insurance / yr
- $1,499 – $2,785
Heat risk 6/10 · Moderate
- Hot days now (above 110°F)
- 7 days/yr
- Hot days in 30 yrs
- 22 days/yr
Wind risk 4/10 · Minor
- Chance of severe wind over 30 yrs
- 11.0%
Air-quality risk 2/10 · Minimal
- Unhealthy air days now
- 0 days/yr
- Unhealthy air days in 30 yrs
- 2 days/yr
Risk factors via First Street. Map © Google.
Why this score? — see what drove the D+ grade
The composite is a weighted blend of 9 inputs, each scored 0–100. Each bar is that input's sub-score; the figure is the points it added to the 100-point composite (weight × sub-score).
- Cash flow +15.0/30.0
- ARV discount +7.5/15.0
- 1% rule +5.0/10.0
- DSCR +5.0/10.0
- Appreciation +4.7/10.0
- Livability +3.1/5.0
- Rent growth +2.5/5.0
- Condition / age +2.5/5.0
- Schools +0.9/10.0
$10,995
🖨 Deal sheet 📄 Offer letter ✓ Due diligence
Listing remarks MLS
This House is a part of a Package Deal which includes 121 E. Quinn(Vacant Lot). These two properties together are $7,000.
Key facts
- Spacious lot
- Adjoining vacant lot
- Conveniently located
Tags
Property features AI
Exterior
- Parking: No garage
- Utilities: Public water; Public sewer
- Home design: One-story residential property; Frame construction; Slab foundation
- Construction: Frame construction; Composition roof; Slab foundation; Built on a crawl space
- Exterior features: Corner lot; No specified exterior amenities; Composition roof
Interior
- Flooring: Tile
- Bathrooms: 1 full bathroom
- Heating & cooling: No heating; No cooling
- Interior features: Water heater; Tile flooring; Crawl space (no full basement)
Neighborhood map
What this means for you Summary
Snapshot
- This is a 2-bed/1.0-bath single-family listed at $11k.
Deal economics
- At list price, monthly cash flow is $574 ($7k/yr) — positive.
- The deal already cash-flows at list — no discount required.
- Meets the 1% rule at list price ($814 rent vs $11k).
- Recommended offer: $11k (1.5% below list) — sets the bar for market timing.
Location & tenants
- Location reads 61/100 on livability (#238 in AR) — a middle-class / working-renter tenant base. Strengths: cost of living A+, housing A+; Watch: crime F, amenities F, commute F.
- Osceola School District (town): math 10% / reading 13% proficiency, ranked #231 of 238 in AR (top 97%) — low school quality limits family demand, transient renter base, plan for 1-2y turnover; 93% free/reduced lunch — lower-income household profile, screen leases tightly.
- Zoned schools: Osceola Elementary School (math 17% / reading 12%, grade F, #408 of 454 statewide, top 91%, 307 students, 99% FRL); Osceola Middle School (math 9% / reading 14%, grade F, #190 of 201 statewide, top 95%, 245 students, 99% FRL); Osceola High School (math 8% / reading 12%, grade F, #276 of 292 statewide, top 96%, 271 students, 99% FRL).
- Market conditions: 29 active listings in the ZIP; 69 units permitted in Mississippi County in 2024 (0 in 5+ unit buildings).
Forward outlook
- In year one you build about $2 of equity ($76 loan paydown + $-74 appreciation (-0.7% local appreciation)).
- Mississippi County population projected at -30% by 2050 — secular population decline; favor cash flow + early exit over multi-decade hold.
- At projected returns (-0.7% appreciation + 3.0% rent growth), your $3k cash investment doubles in ~1 year — after that, you're playing with house money.
Negotiation context
- It's been on market 29 days — a 2% lower offer ($11k) is reasonable based on typical stale-listing flexibility.
- 3 sale attempts with the ask held roughly flat each time — persistent listings suggest the price (not the market) is what's stuck; bring a comps-based counter.
- Current owner paid $6k; list at $11k implies a 100% gain — meaningful room to come down on a strong offer.
Risks & watch-outs
- Climate carrying-cost: extreme-heat days projected 7→22/yr by 2055 (HVAC capex compounding) — expect insurance premiums to compound above CPI over the hold.
Questions for the listing agent
- Built in 1978 — when were the roof, HVAC, electrical panel, plumbing, and water heater last replaced?
- Is there a deadline driving the sale (1031 exchange, divorce, estate, relocation)? That informs how much negotiation room exists.
- Schools are F-rated, which usually means shorter tenancies and higher turnover. Who's the typical renter profile here, and what's been the actual vacancy rate?
- Crime grade is F in this area — have there been break-ins, vandalism, or insurance claims at this property in the last 3 years? What carrier currently insures it and at what premium?
- The area grade is low — what's the realistic commute time and amenity access for the typical tenant pool here? Any planned neighborhood developments (good or bad) we should know about?
- What's the average days-on-market for RENTAL listings here right now (not sales)? A rising rental-DOM trend means longer vacancies and softer asking-rent achievability than the comps imply.
- What's the recent tenant-quality profile in this submarket — average credit score on applications, eviction rate, late-payment / NSF rate, and stable-employment percentage? A property-management company in the area should have these aggregated.
- How much new for-sale + rental construction is in the pipeline within 1–3 miles? Heavy new supply typically softens prices + rents 12–24 months out; constrained supply supports both.
Investment metrics
- 1% rule
- 7.40% ✓
- Cap rate
- 68.93%
- Cash-on-cash
- 223.69%
- DSCR
- 10.95
- GRM
- 1.1
CMA / ARV
- ARV (on-the-fly)
- $5,408
- Comps found
- 1
Show comp detail 1 sale within ~0.75 mi
| Address | Dist | Beds/Ba | Sqft | Sold | Price | $/sf | Match |
|---|---|---|---|---|---|---|---|
| 117 E Quinn | 0.00mi | 2/1.0 | 676 (0%) | 8mo | $5,500 | $8 | 93 |
Match score weights: distance 35% · size 25% · config 20% · recency 20%. Top-matched comps best support the ARV.
Projected returns pro-forma
-0.67% appreciation · 3.0% rent growth · sell at horizon
- IRR
- —
- Equity multiple
- 12.66×
- Total profit
- $35,896
- Equity at exit
- $2,829
- IRR
- —
- Equity multiple
- 26.80×
- Total profit
- $79,424
- Equity at exit
- $3,123
Cash invested: $3,079 (down + closing). Projections, not guarantees.
Landlord ↔ Tenant lean methodology
- Overall (STATE)
- 92 Strongly Landlord-Friendly
- State Arkansas
- 92 Strongly Landlord-Friendly · R+14
- County
- — inherits STATE
- City
- — inherits STATE
ZIP-level market 72370
- Home prices YoY
- -0.4%
- Active inventory
- 29
- Price-to-rent
- 1.1×
Monthly cashflow live
- Estimated rent
- $814 medium interval (Pro) →
- Mortgage (P&I)
- −$58
- Tax from tax record
- −$7 /mo · $85/yr
- Insurance
- −$5
- HOA
- −$0
- Vacancy / Maint / Mgmt
- −$171
- Net cashflow
- $574
Break-even live
UW: 25.0% down · 7.5% · 30yr · 1.5% tax · 5.0% vac · 8.0% maint · 8.0% mgmt
Financing live
Cash to close
- Down payment
- $2,749
- Closing costs
- $330
- Reserves months
- —
- Total cash needed
- —
Loan-product check · same deal, 3 products live
Conventional
25% down · 7.5% · 30yr
- Down + closing
- —
- Monthly P&I
- —
- Monthly cashflow
- —
- DSCR
- —
- Eligible?
- —
Personal DTI + credit; lowest rate.
DSCR
20% down · 8.5% · 30yr
- Down + closing
- —
- Monthly P&I
- —
- Monthly cashflow
- —
- DSCR
- —
- Eligible?
- —
No personal income docs; deal must DSCR.
Hard money
10% down · 12.0% · 12mo
- Down + closing
- —
- Monthly P&I
- —
- Monthly cashflow
- —
- DSCR
- —
- Eligible?
- —
Short-term bridge; refi at stabilization.
Listing history 23 events
-
2026-06-19days on market $10,995 Active 29 DOM
-
2026-06-18days on market $10,995 Active 28 DOM
-
2026-06-17days on market $10,995 Active 27 DOM
-
2026-06-16days on market $10,995 Active 26 DOM
-
2026-06-15days on market $10,995 Active 25 DOM
-
2026-06-14days on market $10,995 Active 23 DOM
-
2026-06-12days on market $10,995 Active 22 DOM
-
2026-06-09days on market $10,995 Active 19 DOM
-
2026-06-08days on market $10,995 Active 18 DOM
-
2026-06-07days on market $10,995 Active 17 DOM
-
2026-06-07days on market $10,995 Active 16 DOM
-
2026-06-04days on market $10,995 Active 13 DOM
-
2026-06-02days on market $10,995 Active 12 DOM
-
2026-06-01days on market $10,995 Active 11 DOM
-
2026-05-31days on market $10,995 Active 10 DOM
-
2026-05-31days on market $10,995 Active 9 DOM
-
2026-05-22$10,995 Active
-
2026-05-19$14,999 Active
-
2025-10-29soldstatus $5,500
-
2025-10-24soldstatus $5,500 Closed 121-char remark
Show marketing remark (121 chars)
This House is a part of a Package Deal which includes 121 E. Quinn(Vacant Lot). These two properties together are $7,000.
-
2025-10-13historical 121-char remark
Show marketing remark (121 chars)
This House is a part of a Package Deal which includes 121 E. Quinn(Vacant Lot). These two properties together are $7,000.
-
2025-10-03price $7,000 121-char remark
Show marketing remark (121 chars)
This House is a part of a Package Deal which includes 121 E. Quinn(Vacant Lot). These two properties together are $7,000.
-
2025-09-26$9,500 Active 121-char remark
Show marketing remark (121 chars)
This House is a part of a Package Deal which includes 121 E. Quinn(Vacant Lot). These two properties together are $7,000.
ⓘ Source: listings_history table (triggers on properties + properties_extension) + one-shot
backfill from property_details.listing_events for pre-trigger history.
Tax reassessment forecast AR · Resets to sale price
- Current annual tax
- $85 · $7/mo
- Projected year-2 tax
- $85 · $7/mo
- Expected delta
- $0/yr ($0/mo · 0.0%)
ⓘ Screening estimate from a state-policy table — verify with the county assessor before closing.
Climate risk First Street
- Flood 4/10 Moderate FEMA zone X (shaded) · 24% chance over 30 yrs
- Wildfire 1/10 Low
- Heat 6/10 Major 7 d/yr ≥110°F today · 22 d/yr by 30 yrs out
- Wind 4/10 Moderate 11% chance of damaging wind over 30 yrs
- Air quality 2/10 Low 0 unhealthy d/yr today · 2 by 30 yrs out
Nearby sold comps map
Loading sold comps map…
Walkable amenities ~0.75 mi
Loading nearby amenities…
Taxation est. · year 1
- Rental income
- $9,770
- − Mortgage interest
- −$616
- − Property taxes
- −$85
- − Insurance
- −$55
- − Repairs & maintenance
- −$782
- − Management
- −$782
- − Depreciation
- −$320
- Taxable income
- $7,131
- Est. tax owed @ 24.0%
- −$1,712
- After-tax cash flow
- $5,175/yr
For passive investors: Depreciation is non-cash, so a rental often shows a tax loss while cash-flowing — sheltering income. Rental losses are passive: they offset passive income freely, and up to $25,000/yr can offset ordinary (W-2) income if you actively participate and your MAGI is under $100k (phasing out to $0 by $150k); unused losses carry forward. On sale, claimed depreciation is recaptured at up to 25%, and gains may owe capital-gains tax (a 1031 exchange can defer both). Figures are a year-1 estimate at your 24.0% rate — not tax advice; consult a CPA.
Schools (NCES district)
- District
- Osceola School District
- NCES district ID
- 0510950
- Math proficiency
- 10% ▼ -16.00%
- Reading proficiency
- 13% ▼ -7.00%
- Median HH income
- $30,782
- Composite
- 9.02/100
- National rank
- #9878
- State rank
- #231 of 238 in AR
Livability — Osceola
- Score
- 61/100
- State rank
- #238
- US rank
- #17827
Category grades
Schools grade is shown separately in the Schools card above.
Census & demographics
- Census place
- Osceola, AR
- Population (ZIP)
- 7,282
Population outlook (Mississippi County) Hauer SSP2
- Today (2025)
- 38,959 people
- By 2030
- 36,401 · -6.6%
- By 2040
- 31,526 · -19.1%
- By 2050
- 27,058 · -30.5%
- By 2075
- 17,847 · -54.2%
- By 2100
- 11,024 · -71.7%
Race, ethnicity, and origin ACS 2023
- Neighborhood character
- Diverse neighborhood (Simpson 0.59)
- Race & ethnicity
- Black 53% White 36% Two or more races 8% Hispanic / Latino 5%
- Hispanic origin (detail)
- Mexican 5%
- Common ancestry
- Lithuanian 1%
- Foreign-born
- 1% · Canada
- Languages at home
- 97% English-only · Spanish 2% Other Asian/Pacific 1%
Political lean MEDSL · Mississippi
- 2024 margin
- Solid R (+31.6) · D 33.4% · R 65.0% · Other 1.7%
- 2008→2024 swing
- -29.4pp toward R · 2008: -2.2pp · 2024: -31.6pp
- All cycles
- 2024: R+31.6 2020: R+22.2 2016: R+10.5 2012: R+1.1 2008: R+2.2
Not yet ingested
- Civics
- —
Market trends
- HPI YoY
- ▼ -0.67%
- Current HPI
- 178.93
- Rent YoY
- —
- Metro
- —
- State GDP YoY
- ▲ 3.80%
- F500 in state
- 10
Industry mix (Fortune 500 HQ in AR)
| Industry | F500 HQs | Revenue |
|---|---|---|
| Retail | 1 | $681B |
|
||
| Food / Agriculture | 1 | $53B |
|
||
| Retail / Energy | 1 | $22B |
|
||
| Transportation / Logistics | 1 | $12B |
|
||
| Energy | 1 | $4B |
|
||
Price history
+15.7% since first listed7 events — show timeline
- 2026-05-22 Listed $10,995 EARA
- 2026-05-19 Listed $14,999 EARA
- 2025-10-29 Sold (Public Records) $5,500 Public Records
- 2025-10-24 Sold (MLS) $5,500 NEABOR MLS
- 2025-10-13 Delisted — NEABOR MLS
- 2025-10-03 Price Changed $7,000 NEABOR MLS
- 2025-09-26 Listed $9,500 NEABOR MLS
Property tax history
+7.0%/yrLatest (2025): $85 · +7.0% YoY. Source: county tax records.
Cash-flow waterfall
monthlySold comps — $/sqft
last 12 mo · ≤1 miLoading sold comps…