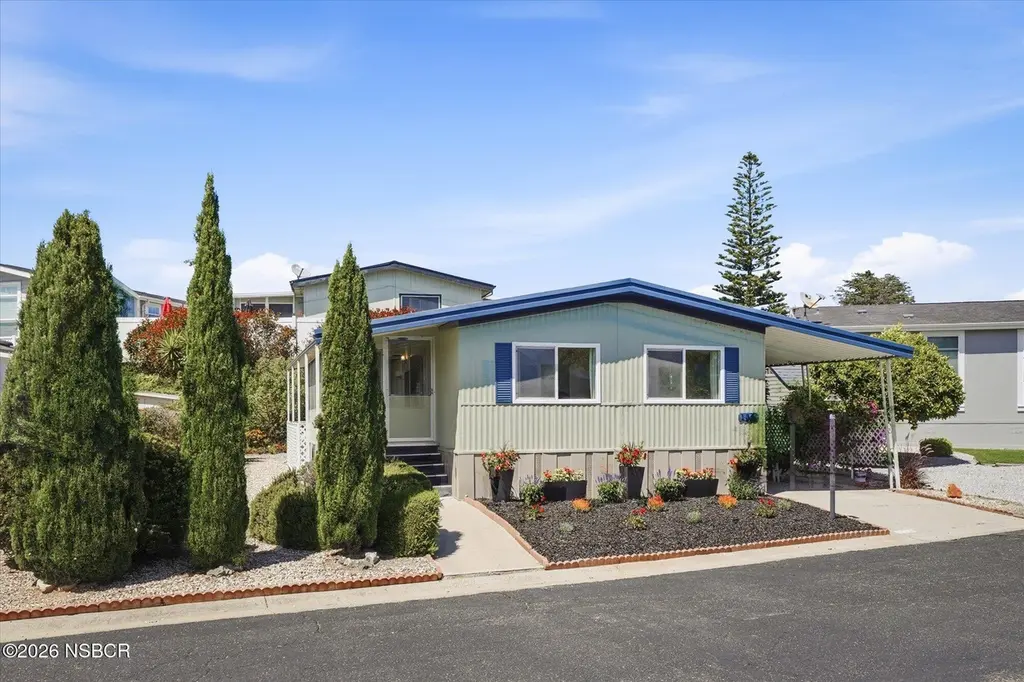
201 Five Cities #133
Pismo Beach, CA 93449
$385,000D
2 bd · 1.0 ba ·
1,100 sqft ·
Built 1975
· Manufactured
· Active
· 57 DOM
Cashflow @ list (25.0% down · 7.5%)
Estimated rent
$2,986/mo
Mortgage (P&I)
−$2,019
Tax + insurance
−$642
HOA
−$0
Vac / Maint / Mgmt
−$627
Net cashflow
$-301/mo
Annual
$-3,616/yr
Cap rate
5.35%
Cash-on-cash
-3.35%
DSCR
0.85
1% rule
0.78%
Cash to close
$107,800
Investor read
- This is a 2-bed/1.0-bath manufactured listed at $385k.
- At list price, monthly cash flow is $-301 ($-4k/yr) — negative.
- To cash-flow at today's rent, offer at most $341k (11.3% below list).
- To meet the 1% rule (rent ≥ 1% of price), the offer needs to be $299k (22.4% below list).
- It's been on market 57 days — a 3% lower offer ($373k) is reasonable based on typical stale-listing flexibility.
- Recommended offer: $299k (22.4% below list) — sets the bar for 1% rule.
- Local home prices are declining (-3.0%/yr); year-one equity from $3k of loan paydown is wiped out by about $12k of value loss. Plan a longer hold.
- Location reads 70/100 on livability (#229 in CA) — a middle-class / working-renter tenant base. Strengths: employment A+, health & safety A+, amenities B; Watch: crime D+, commute F, cost of living F.
- Lucia Mar Unified (town): math 42% / reading 56% proficiency, ranked #433 of 1,400 in CA (top 31%) — families likely to look elsewhere, expect single-tenant / working-renter base with shorter leases.
- Zoned schools: Shell Beach Elementary (325 students, 38% FRL); Judkins Middle (458 students, 64% FRL); Arroyo Grande High (1,991 students, 48% FRL).
- Market conditions: Rents rising fast (+9.2%/yr); 58 active listings in the ZIP; 12 comparable units currently listed for rent nearby; rentals lingering (median 46d on market — plan ~5-8 weeks vacancy on turnover, expect pricing pressure); 50% of comp listings sitting > 30 days — soft ceiling on asking rent; high-income renter base; 1,104 units permitted in San Luis Obispo County in 2024 (273 in 5+ unit buildings).
- San Luis Obispo County population projected at +20% by 2050 — long-run rental-demand tailwind backs the buy-and-hold thesis.
- 4 sale attempts since 19y ago with the ask held roughly flat each time — persistent listings suggest the price (not the market) is what's stuck; bring a comps-based counter.
- Current owner paid $105k; list at $385k implies a 267% gain — meaningful room to come down on a strong offer.
- Cap rate 5.4% vs local median 1.1% in Pismo Beach — top-decile yield for the area; either an underpriced asset or a hidden risk that comps aren't pricing in. Stress-test before assuming the spread holds.
- This rent runs 30% of the median local income ($118k/yr) — at the standard rent-burdened threshold; future hikes will face affordability resistance.
Questions for listing agent
- What do current leases actually rent for vs. the listed asking? Can we see a recent rent roll and the last 12 months of T-12 income?
- It's been on market 57 days. Have you received any prior offers? Is the seller open to a 22% concession, seller financing, or rate buy-down credit?
- Built in 1975 — when were the roof, HVAC, electrical panel, plumbing, and water heater last replaced?
- Is there a deadline driving the sale (1031 exchange, divorce, estate, relocation)? That informs how much negotiation room exists.
- Schools are B-rated — typically a magnet for longer-tenancy family renters. What's the average tenant stay here, and is there a school-zone premium baked into asking?
- Crime grade is D in this area — have there been break-ins, vandalism, or insurance claims at this property in the last 3 years? What carrier currently insures it and at what premium?
- The area grade is low — what's the realistic commute time and amenity access for the typical tenant pool here? Any planned neighborhood developments (good or bad) we should know about?
- What's the average days-on-market for RENTAL listings here right now (not sales)? A rising rental-DOM trend means longer vacancies and softer asking-rent achievability than the comps imply.
CashFlowRE · CFR-CBVC56FN8V6QG1
· Data 22 h ago
cashflowre.app · 2026-05-29