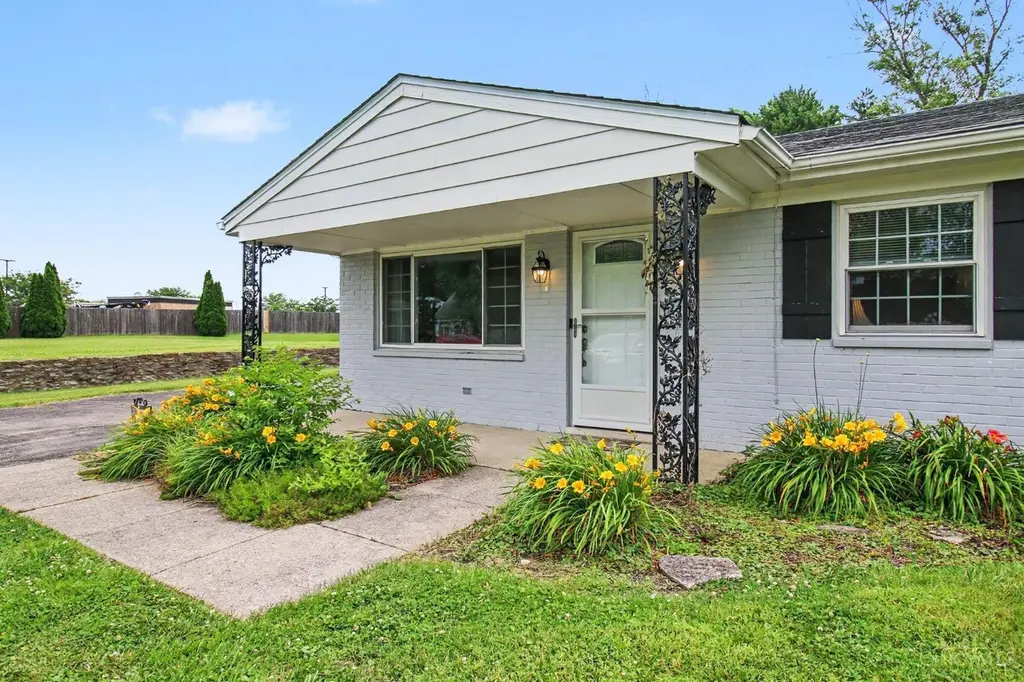
3162 Ebenezer Rd
Bridgetown, OH 45248
$250,000D
3 bd · 1.0 ba ·
1,102 sqft ·
Built 1965
· SingleFamily
· Active
· 10 DOM
Cashflow @ list (25.0% down · 7.5%)
Estimated rent
$1,974/mo
Mortgage (P&I)
−$1,311
Tax + insurance
−$315
HOA
−$0
Vac / Maint / Mgmt
−$414
Net cashflow
$-67/mo
Annual
$-808/yr
Cap rate
5.97%
Cash-on-cash
-1.15%
DSCR
0.95
1% rule
0.79%
Cash to close
$70,000
Investor read
- This is a 3-bed/1.0-bath single-family listed at $250k.
- At list price, monthly cash flow is $-67 ($-808/yr) — negative.
- To cash-flow at today's rent, offer at most $238k (4.8% below list).
- To meet the 1% rule (rent ≥ 1% of price), the offer needs to be $197k (21.1% below list).
- Only 10 days on market — expect competitive offers; lowballing is unlikely to land.
- Recommended offer: $197k (21.1% below list) — sets the bar for 1% rule.
- Local home prices are declining (-3.0%/yr); year-one equity from $2k of loan paydown is wiped out by about $8k of value loss. Plan a longer hold.
- Location reads 82/100 on livability (#78 in OH, #1,171 nationally) — a professional / high-income tenant draw. Strengths: commute A+, cost of living A+, housing A+; Watch: amenities F.
- Oak Hills Local (suburban): math 68% / reading 70% proficiency, ranked #141 of 656 in OH (top 22%) — acceptable for families but not a draw, mixed tenant base, ~2y average lease.
- Zoned schools: Oakdale Elementary School (math 74% / reading 68%, grade A-, #371 of 1,584 statewide, top 24%, 730 students, 37% FRL); Bridgetown Middle School (math 71% / reading 77%, grade A, #94 of 654 statewide, top 15%, 648 students, 0% FRL); Oak Hills High School (math 8% / reading 69%, grade F, #557 of 781 statewide, top 72%, 2,325 students, 0% FRL).
- Market conditions: 101 active listings in the ZIP; 4 comparable units currently listed for rent nearby; rentals at typical pace (median 26d on market — plan ~3-4 weeks tenant-placement turnaround); solid renter incomes; 801 units permitted in Hamilton County in 2024 (190 in 5+ unit buildings).
- Current owner paid $2k; list at $250k implies a 11264% gain — meaningful room to come down on a strong offer.
- Cap rate 6.0% vs local median 3.1% in Bridgetown — top-decile yield for the area; either an underpriced asset or a hidden risk that comps aren't pricing in. Stress-test before assuming the spread holds.
Questions for listing agent
- What do current leases actually rent for vs. the listed asking? Can we see a recent rent roll and the last 12 months of T-12 income?
- Built in 1965 — when were the roof, HVAC, electrical panel, plumbing, and water heater last replaced?
- Is there a deadline driving the sale (1031 exchange, divorce, estate, relocation)? That informs how much negotiation room exists.
- The area grade is low — what's the realistic commute time and amenity access for the typical tenant pool here? Any planned neighborhood developments (good or bad) we should know about?
- What's the average days-on-market for RENTAL listings here right now (not sales)? A rising rental-DOM trend means longer vacancies and softer asking-rent achievability than the comps imply.
- What's the recent tenant-quality profile in this submarket — average credit score on applications, eviction rate, late-payment / NSF rate, and stable-employment percentage? A property-management company in the area should have these aggregated.
- How much new for-sale + rental construction is in the pipeline within 1–3 miles? Heavy new supply typically softens prices + rents 12–24 months out; constrained supply supports both.
CashFlowRE · CFR-CC291ZFFP69QJC
· Data 1 day ago
cashflowre.app · 2026-05-29