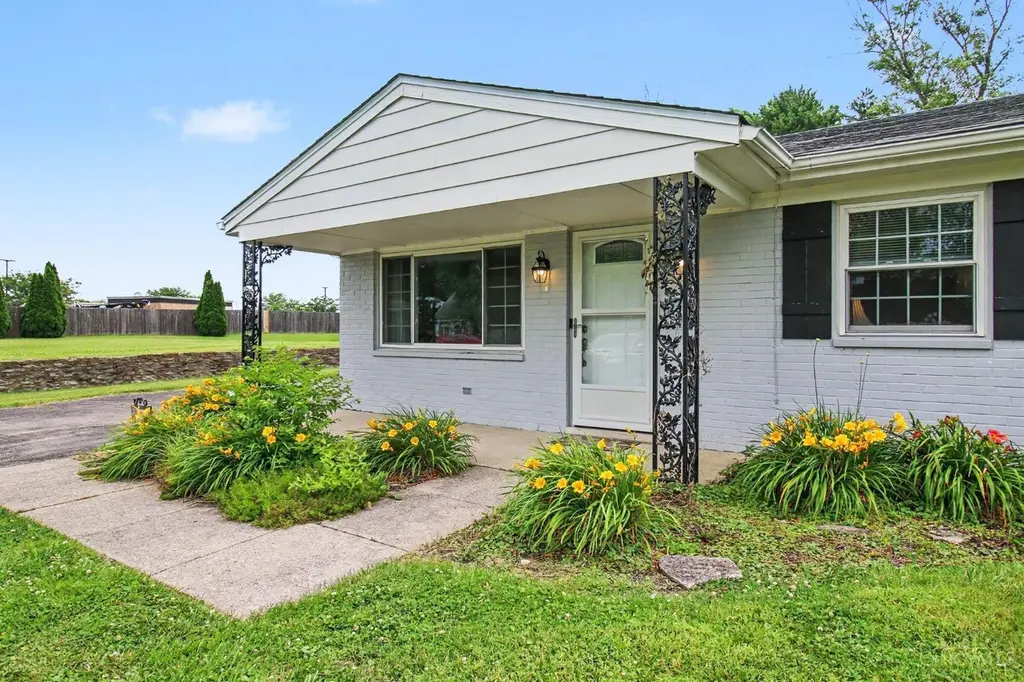
3162 Ebenezer Rd · Bridgetown, OH
Flood risk 1/10 · Minimal
- FEMA flood zone
- X (unshaded)
- Chance of flooding over 30 yrs
- 0.0%
- Est. flood insurance / yr
- $507 – $1,088
Fire risk 1/10 · Minimal
- Est. fire insurance / yr
- $713 – $1,323
Heat risk 4/10 · Minor
- Hot days now (above 102°F)
- 7 days/yr
- Hot days in 30 yrs
- 19 days/yr
Wind risk 2/10 · Minimal
- Chance of severe wind over 30 yrs
- 1.0%
Air-quality risk 2/10 · Minimal
- Unhealthy air days now
- 1 days/yr
- Unhealthy air days in 30 yrs
- 2 days/yr
Risk factors via First Street. Map © Google.
Why this score? — see what drove the D grade
The composite is a weighted blend of 9 inputs, each scored 0–100. Each bar is that input's sub-score; the figure is the points it added to the 100-point composite (weight × sub-score).
- Cash flow +11.8/30.0
- ARV discount +9.1/15.0
- Schools +6.0/10.0
- Livability +4.1/5.0
- DSCR +3.5/10.0
- 1% rule +2.9/10.0
- Rent growth +2.5/5.0
- Condition / age +2.5/5.0
- Appreciation +0.0/10.0
$250,000
🖨 Deal sheet (PDF) 📄 Offer letter ✓ Due diligence
Listing remarks
Well maintained brick ranch featuring updated kitchen with walkout. Great home for those wanting first floor living with few steps.
Key facts
- First floor living
- Updated kitchen
- Brick ranch
Tags
Property features AI
Finance
- Other: Lease not considered
- HOA & community: No HOA
Exterior
- Parking: Detached garage with 2 garage spaces; Driveway parking
- Utilities: Public water; Public sewer; Electric water heating; Electric power
- Home design: Ranch-style single family home; One level; Slab foundation
- Construction: Brick construction; Shingle roof; Built on slab foundation
- Exterior features: Double-hung windows; Less than 0.5 acre lot
Interior
- Kitchen: Eat-in kitchen with laminate flooring; Dishwasher; Oven/Range; Refrigerator
- Bedrooms: 3 bedrooms, all on the main level
- Flooring: Laminate flooring in kitchen and living areas
- Bathrooms: 1 full bathroom on the main level; 1 half bathroom
- Heating & cooling: Baseboard heating; Wall unit cooling
- Interior features: Walkout living room; Eat-in kitchen; Total of 4 rooms
- Laundry & utility: Electric water heater
Neighborhood map
What this means for you Summary
Snapshot
- This is a 3-bed/1.0-bath single-family listed at $250k.
Deal economics
- At list price, monthly cash flow is $-67 ($-808/yr) — negative.
- To cash-flow at today's rent, offer at most $238k (4.8% below list).
- To meet the 1% rule (rent ≥ 1% of price), the offer needs to be $197k (21.1% below list).
- Recommended offer: $197k (21.1% below list) — sets the bar for 1% rule.
- Cap rate 6.0% vs local median 3.1% in Bridgetown — top-decile yield for the area; either an underpriced asset or a hidden risk that comps aren't pricing in. Stress-test before assuming the spread holds.
Location & tenants
- Location reads 82/100 on livability (#78 in OH, #1,171 nationally) — a professional / high-income tenant draw. Strengths: commute A+, cost of living A+, housing A+; Watch: amenities F.
- Oak Hills Local (suburban): math 68% / reading 70% proficiency, ranked #141 of 656 in OH (top 22%) — acceptable for families but not a draw, mixed tenant base, ~2y average lease.
- Zoned schools: Oakdale Elementary School (math 74% / reading 68%, grade A-, #371 of 1,584 statewide, top 24%, 730 students, 37% FRL); Bridgetown Middle School (math 71% / reading 77%, grade A, #94 of 654 statewide, top 15%, 648 students, 0% FRL); Oak Hills High School (math 8% / reading 69%, grade F, #557 of 781 statewide, top 72%, 2,325 students, 0% FRL).
- Market conditions: 101 active listings in the ZIP; 4 comparable units currently listed for rent nearby; rentals at typical pace (median 26d on market — plan ~3-4 weeks tenant-placement turnaround); solid renter incomes; 801 units permitted in Hamilton County in 2024 (190 in 5+ unit buildings).
Forward outlook
- Local home prices are declining (-3.0%/yr); year-one equity from $2k of loan paydown is wiped out by about $8k of value loss. Plan a longer hold.
Negotiation context
- Only 10 days on market — expect competitive offers; lowballing is unlikely to land.
- Current owner paid $2k; list at $250k implies a 11264% gain — meaningful room to come down on a strong offer.
Questions for the listing agent
- What do current leases actually rent for vs. the listed asking? Can we see a recent rent roll and the last 12 months of T-12 income?
- Built in 1965 — when were the roof, HVAC, electrical panel, plumbing, and water heater last replaced?
- Is there a deadline driving the sale (1031 exchange, divorce, estate, relocation)? That informs how much negotiation room exists.
- The area grade is low — what's the realistic commute time and amenity access for the typical tenant pool here? Any planned neighborhood developments (good or bad) we should know about?
- What's the average days-on-market for RENTAL listings here right now (not sales)? A rising rental-DOM trend means longer vacancies and softer asking-rent achievability than the comps imply.
- What's the recent tenant-quality profile in this submarket — average credit score on applications, eviction rate, late-payment / NSF rate, and stable-employment percentage? A property-management company in the area should have these aggregated.
- How much new for-sale + rental construction is in the pipeline within 1–3 miles? Heavy new supply typically softens prices + rents 12–24 months out; constrained supply supports both.
Investment metrics
- 1% rule
- 0.79% ✗
- Cap rate
- 5.97%
- Cash-on-cash
- -1.15%
- DSCR
- 0.95
- GRM
- 10.6
CMA / ARV
- ARV (on-the-fly)
- $258,970
- Comps found
- 12
Show comp detail 12 sales within ~0.75 mi
| Address | Dist | Beds/Ba | Sqft | Sold | Price | $/sf | Match |
|---|---|---|---|---|---|---|---|
| 3365 Harwinton Ln | 0.33mi | 3/2.0 | 1,188 (+8%) | 9mo | $240,000 | $202 | 60 |
| 6172 Werk Rd | 0.15mi | 2/1.5 (-1) | 976 (-11%) | 11mo | $275,000 | $282 | 58 |
| 6268 Sharlene Dr | 0.39mi | 3/1.5 | 1,247 (+13%) | 1mo | $292,500 | $235 | 57 |
| 5963 Oakapple Dr | 0.60mi | 3/2.0 | 1,050 (-5%) | 7mo | $195,000 | $186 | 54 |
| 3496 Ebenezer Rd | 0.57mi | 3/2.0 | 1,064 (-3%) | 13mo | $285,000 | $268 | 52 |
| 5805 Childs Ave | 0.72mi | 4/3.0 (+1) | 1,085 (-2%) | 1mo | $289,000 | $266 | 50 |
| 6234 Charity Dr | 0.46mi | 3/1.5 | 1,236 (+12%) | 11mo | $266,000 | $215 | 47 |
| 3459 Ebenezer Rd | 0.51mi | 3/2.0 | 1,208 (+10%) | 13mo | $240,000 | $199 | 46 |
| 3412 Eyrich Rd | 0.57mi | 2/2.0 (-1) | 1,228 (+11%) | 0mo | $224,000 | $182 | 45 |
| 3451 Ebenezer Rd | 0.50mi | 3/3.0 | 1,248 (+13%) | 10mo | $314,900 | $252 | 38 |
| 3491 Eyrich Rd | 0.66mi | 2/2.0 (-1) | 1,224 (+11%) | 10mo | $230,000 | $188 | 33 |
| 5768 Lawrence Rd | 0.70mi | 3/2.5 | 1,247 (+13%) | 8mo | $305,000 | $245 | 32 |
Match score weights: distance 35% · size 25% · config 20% · recency 20%. Top-matched comps best support the ARV.
Projected returns pro-forma
-3.0% appreciation · 3.0% rent growth · sell at horizon
- IRR
- -18.2%
- Equity multiple
- 0.36×
- Total profit
- $-44,831
- Equity at exit
- $37,276
- IRR
- -10.5%
- Equity multiple
- 0.36×
- Total profit
- $-44,691
- Equity at exit
- $21,615
Cash invested: $70,000 (down + closing). Projections, not guarantees.
Landlord ↔ Tenant lean methodology
- Overall (STATE)
- 73 Landlord-Friendly
- State Ohio
- 73 Landlord-Friendly · R+6
- County
- — inherits STATE
- City
- — inherits STATE
ZIP-level market 45248
- Active inventory
- 101
- Price-to-rent
- 10.6×
Monthly cashflow live
- Estimated rent
- $1,974 medium interval (Pro) →
- Mortgage (P&I)
- −$1,311
- Tax from tax record
- −$211 /mo · $2,535/yr
- Insurance
- −$104
- HOA
- −$0
- Vacancy / Maint / Mgmt
- −$414
- Net cashflow
- $-67
Break-even live
Sensitivity live
| Price | -10% $74 | -5% $3 | +0% $-67 | +5% $-138 | +10% $-209 |
|---|---|---|---|---|---|
| Rent | -10% $-223 | -5% $-145 | +0% $-67 | +5% $11 | +10% $89 |
| Rate | -1.0pp $59 | -0.5pp $-4 | base $-67 | +0.5pp $-132 | +1.0pp $-198 |
UW: 25.0% down · 7.5% · 30yr · 1.5% tax · 5.0% vac · 8.0% maint · 8.0% mgmt
Financing live
Cash to close
- Down payment
- $62,500
- Closing costs
- $7,500
- Reserves months
- —
- Total cash needed
- —
Loan-product check · same deal, 3 products live
Conventional
25% down · 7.5% · 30yr
- Down + closing
- —
- Monthly P&I
- —
- Monthly cashflow
- —
- DSCR
- —
- Eligible?
- —
Personal DTI + credit; lowest rate.
DSCR
20% down · 8.5% · 30yr
- Down + closing
- —
- Monthly P&I
- —
- Monthly cashflow
- —
- DSCR
- —
- Eligible?
- —
No personal income docs; deal must DSCR.
Hard money
10% down · 12.0% · 12mo
- Down + closing
- —
- Monthly P&I
- —
- Monthly cashflow
- —
- DSCR
- —
- Eligible?
- —
Short-term bridge; refi at stabilization.
Rent comps 4 comps
| Address | Beds | Baths | Sqft | Rent | $/sqft | DOM | Units | Dist |
|---|---|---|---|---|---|---|---|---|
| 2964 Werkridge Dr Cincinnati, OH | 3.0 | 3.0 | 1462 | $2,300 | $1.57 | 25d | 1 | 0.44mi |
| 3717 Eyrich Rd Cincinnati, OH | 2.0 | 1.0 | 884 | $1,795 | $2.03 | 4d | 1 | 0.97mi |
| 5517 Surrey Ave Cincinnati, OH | 2.0 | 1.5 | 940 | $1,549 | $1.65 | 45d | 1 | 1.30mi |
| 5694 Bridgetown Rd #16 Cincinnati, OH | 2.0 | 2.0 | 1184 | $1,795 | $1.52 | 9d | 1 | 1.30mi |
Listing history 7 events
-
2026-06-21days on market $250,000 Active 10 DOM
-
2026-06-18days on market $250,000 Active 7 DOM
-
2026-06-17days on market $250,000 Active 6 DOM
-
2026-06-16days on market $250,000 Active 5 DOM
-
2026-06-15days on market $250,000 Active 4 DOM
-
2026-06-13remarks 131-char remark
-
2026-06-13$250,000 Active 2 DOM
ⓘ Source: listings_history table (triggers on properties + properties_extension) + one-shot
backfill from property_details.listing_events for pre-trigger history.
Tax reassessment forecast OH · Partial reset (capped growth)
- Current annual tax
- $2,535 · $211/mo
- Projected year-2 tax
- $3,218 · $268/mo
- Expected delta
- +$682/yr (+$57/mo · 26.9%)
ⓘ Screening estimate from a state-policy table — verify with the county assessor before closing.
Climate risk First Street
- Flood 1/10 Low FEMA zone X (unshaded) · 0% chance over 30 yrs
- Wildfire 1/10 Low
- Heat 4/10 Moderate 7 d/yr ≥102°F today · 19 d/yr by 30 yrs out
- Wind 2/10 Low 100% chance of damaging wind over 30 yrs
- Air quality 2/10 Low 1 unhealthy d/yr today · 2 by 30 yrs out
Nearby sold comps map
Loading sold comps map…
Walkable amenities ~0.75 mi
Loading nearby amenities…
Taxation est. · year 1
- Rental income
- $23,683
- − Mortgage interest
- −$14,004
- − Property taxes
- −$2,535
- − Insurance
- −$1,250
- − Repairs & maintenance
- −$1,895
- − Management
- −$1,895
- − Depreciation
- −$7,273
- Taxable loss
- −$5,168
- Est. tax savings @ 24.0%
- +$1,240
- After-tax cash flow
- $432/yr
For passive investors: Depreciation is non-cash, so a rental often shows a tax loss while cash-flowing — sheltering income. Rental losses are passive: they offset passive income freely, and up to $25,000/yr can offset ordinary (W-2) income if you actively participate and your MAGI is under $100k (phasing out to $0 by $150k); unused losses carry forward. On sale, claimed depreciation is recaptured at up to 25%, and gains may owe capital-gains tax (a 1031 exchange can defer both). Figures are a year-1 estimate at your 24.0% rate — not tax advice; consult a CPA.
Schools (NCES district)
- District
- Oak Hills Local
- NCES district ID
- 3904737
- Math proficiency
- 68% ▼ -11.00%
- Reading proficiency
- 70% ▼ -8.00%
- Median HH income
- $67,889
- Composite
- 60.25/100
- National rank
- #858
- State rank
- #141 of 656 in OH
Livability — Bridgetown
- Score
- 82/100
- State rank
- #78
- US rank
- #1171
Category grades
Schools grade is shown separately in the Schools card above.
Census & demographics
- Census place
- Bridgetown, OH
- County
- Hamilton · 838,887 people
- Metro
- Cincinnati, OH-KY-IN
- Population (ZIP)
- 23,287
- Household income
- $81,731
- Rent vs Own
- Severe rent burden
- 4.1
Population outlook (Hamilton County) Hauer SSP2
- Today (2025)
- 826,054 people
- By 2030
- 830,947 · +0.6%
- By 2040
- 832,319 · +0.8%
- By 2050
- 822,428 · -0.4%
- By 2075
- 788,688 · -4.5%
- By 2100
- 710,674 · -14.0%
Race, ethnicity, and origin ACS 2023
- Neighborhood character
- Predominantly White (94%)
- Race & ethnicity
- White 94% Two or more races 4% Hispanic / Latino 2% Black 1%
- Common ancestry
- Lithuanian 2% Romanian 2% Slovak 1%
- Foreign-born
- 1%
Political lean MEDSL · Hamilton
- 2024 margin
- D (+14.9) · D 57.0% · R 42.1%
- 2008→2024 swing
- +7.9pp toward D · 2008: 7.0pp · 2024: 14.9pp
- All cycles
- 2024: D+14.9 2020: D+15.9 2016: D+9.5 2012: D+4.9 2008: D+7.0
Not yet ingested
- Civics
- —
Market trends
- HPI YoY
- ▼ -143.68%
- Current HPI
- 193.4863
- Rent YoY
- —
- Metro
- —
- State GDP YoY
- ▲ 1.98%
- F500 in state
- 48
Industry mix (Fortune 500 HQ in OH)
| Industry | F500 HQs | Revenue |
|---|---|---|
| Insurance | 3 | $145B |
|
||
| Industrial Machinery | 3 | $49B |
|
||
| Financial Services | 3 | $24B |
|
||
| Consumer Goods | 2 | $93B |
|
||
| Aerospace / Defense | 2 | $47B |
|
||
| Utilities | 2 | $33B |
|
||
Price history
+11263.6% since first listed2 events — show timeline
- 2026-06-10 Listed $250,000 Cincy MLS
- 1999-03-18 Sold (Public Records) $2,200 Public Records
Property tax history
+7.1%/yrLatest (2025): $2,535 · -0.2% YoY. Source: county tax records.
Cash-flow waterfall
monthlySold comps — $/sqft
last 12 mo · ≤1 miLoading sold comps…