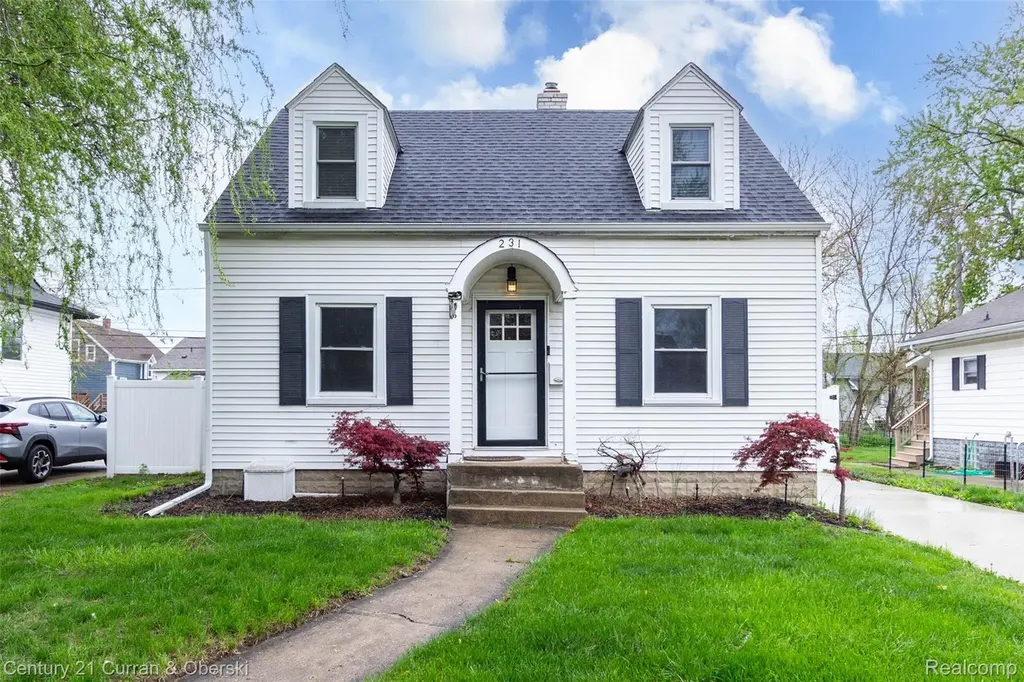
231 Academy St
Ferndale, MI 48220
$299,000D
4 bd · 1.5 ba ·
1,874 sqft ·
Built 1938
· SingleFamily
· Active
· 49 DOM
Cashflow @ list (25.0% down · 7.5%)
Estimated rent
$2,334/mo
Mortgage (P&I)
−$1,568
Tax + insurance
−$381
HOA
−$0
Vac / Maint / Mgmt
−$490
Net cashflow
$-105/mo
Annual
$-1,260/yr
Cap rate
5.87%
Cash-on-cash
-1.50%
DSCR
0.93
1% rule
0.78%
Cash to close
$83,720
Investor read
- This is a 4-bed/1.5-bath single-family listed at $299k.
- At list price, monthly cash flow is $-105 ($-1k/yr) — negative.
- To cash-flow at today's rent, offer at most $280k (6.2% below list).
- To meet the 1% rule (rent ≥ 1% of price), the offer needs to be $233k (21.9% below list).
- It's been on market 49 days — a 3% lower offer ($290k) is reasonable based on typical stale-listing flexibility.
- Recommended offer: $233k (21.9% below list) — sets the bar for 1% rule.
- Local home prices are declining (-3.0%/yr); year-one equity from $2k of loan paydown is wiped out by about $9k of value loss. Plan a longer hold.
- Location reads 90/100 on livability (#8 in MI, #103 nationally) — a professional / high-income tenant draw. Strengths: amenities A+, commute A+, employment A+; Watch: schools D+.
- Ferndale Public Schools (suburban): math 18% / reading 39% proficiency, ranked #366 of 540 in MI (top 68%) — low school quality limits family demand, transient renter base, plan for 1-2y turnover.
- Watch-outs: built in 1938 — expect roof / HVAC / electrical / plumbing capex.
- Market conditions: Rents rising fast (+6.2%/yr); 171 active listings in the ZIP; 12 comparable units currently listed for rent nearby; rentals at typical pace (median 23d on market — plan ~3-4 weeks tenant-placement turnaround); solid renter incomes; 2,614 units permitted in Oakland County in 2024 (721 in 5+ unit buildings).
- Oakland County population projected at +10% by 2050 — modest demand growth; plan on rents tracking national, not racing it.
- 8 sale attempts since 23y ago; this cycle's ask has dropped $30k (9%) from the opening price — seller is motivated, your offer sets the floor, not the list.
- Current owner paid $138k; list at $299k implies a 117% gain — meaningful room to come down on a strong offer.
- Cap rate 5.9% vs local median 4.5% in Ferndale — top-decile yield for the area; either an underpriced asset or a hidden risk that comps aren't pricing in. Stress-test before assuming the spread holds.
- This rent runs 31% of the median local income ($90k/yr) — at the standard rent-burdened threshold; future hikes will face affordability resistance.
Questions for listing agent
- What do current leases actually rent for vs. the listed asking? Can we see a recent rent roll and the last 12 months of T-12 income?
- It's been on market 49 days. Have you received any prior offers? Is the seller open to a 22% concession, seller financing, or rate buy-down credit?
- Built in 1938 — when were the roof, HVAC, electrical panel, plumbing, and water heater last replaced?
- Is there a deadline driving the sale (1031 exchange, divorce, estate, relocation)? That informs how much negotiation room exists.
- Schools are D-rated, which usually means shorter tenancies and higher turnover. Who's the typical renter profile here, and what's been the actual vacancy rate?
- The area grade is low — what's the realistic commute time and amenity access for the typical tenant pool here? Any planned neighborhood developments (good or bad) we should know about?
- What's the average days-on-market for RENTAL listings here right now (not sales)? A rising rental-DOM trend means longer vacancies and softer asking-rent achievability than the comps imply.
- What's the recent tenant-quality profile in this submarket — average credit score on applications, eviction rate, late-payment / NSF rate, and stable-employment percentage? A property-management company in the area should have these aggregated.
CashFlowRE · CFR-CDECCD3YHBW46N
· Data 2 days ago
cashflowre.app · 2026-05-29