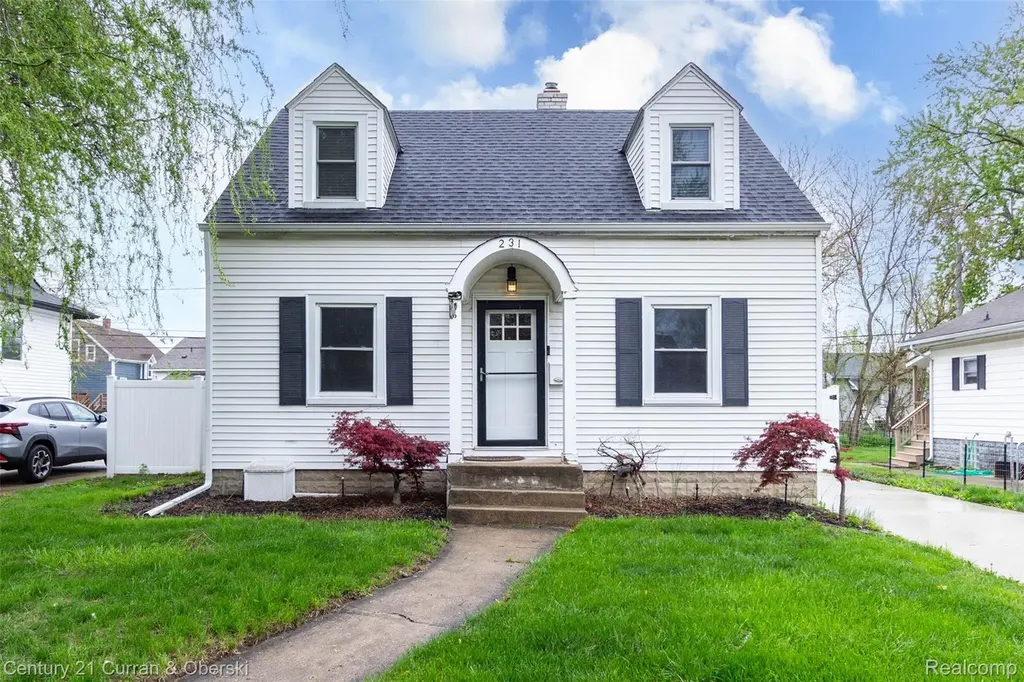
231 Academy St · Ferndale, MI
Flood risk 1/10 · Minimal
- FEMA flood zone
- X (unshaded)
- Chance of flooding over 30 yrs
- 0.0%
- Est. flood insurance / yr
- $473 – $860
Fire risk 1/10 · Minimal
- Est. fire insurance / yr
- $784 – $1,456
Heat risk 3/10 · Minor
- Hot days now (above 97°F)
- 7 days/yr
- Hot days in 30 yrs
- 15 days/yr
Wind risk 2/10 · Minimal
- Chance of severe wind over 30 yrs
- —
Air-quality risk 3/10 · Minor
- Unhealthy air days now
- 3 days/yr
- Unhealthy air days in 30 yrs
- 5 days/yr
Risk factors via First Street. Map © Google.
Why this score? — see what drove the D grade
The composite is a weighted blend of 9 inputs, each scored 0–100. Each bar is that input's sub-score; the figure is the points it added to the 100-point composite (weight × sub-score).
- Cash flow +11.4/30.0
- ARV discount +10.6/15.0
- Livability +4.5/5.0
- Rent growth +4.1/5.0
- DSCR +3.3/10.0
- 1% rule +2.8/10.0
- Schools +2.5/10.0
- Condition / age +2.5/5.0
- Appreciation +0.0/10.0
$299,000
🖨 Deal sheet 📄 Offer letter ✓ Due diligence
Listing remarks MLS
Welcome home! Great location close to downtown Ferndale and all the activities that this vibrant town offers. Charming Cape Cod offers a large updated kitchen with upgraded appliances. Quality cabinets with custom granite counters and backsplash. Spacious dining room with natural wood flooring. Relaxing living room with hardwood flooring. The primary first-floor bedroom is large with hardwood flooring. Luxurious first-floor bathroom features a step-in jetted garden tub plus a full standalone walk-in shower. Enjoy the spacious upper 2 bedrooms with built-in bench seating and a beautiful remodeled full bathroom. Updated windows, newer driveway, newer custom vinyl privacy fence, and much more. Attractive private backyard with a convenient shed and entertaining-sized deck make for enjoyable, relaxing days. You will enjoy all the great restaurants, shops, breweries, theater, and live activities. Don't miss this one, plus a 1 Year Home Warranty. Note: New AC condensing unit being installed.
Key facts
- Hardwood flooring
- Custom counters
- Spacious dining room
Tags
Property features AI
Exterior
- Parking: Driveway; No garage
- Utilities: Public water; Public sewer; Circuit breaker electrical service; Cable available
- Home design: Single family residence; One and one half stories; Ground-level entry with steps; Residential property
- Construction: Aluminum and vinyl siding; Asphalt roof; Block foundation; Partially finished full basement; Home warranty included; Approximately 1,500 above-grade finished square feet and 400 below-grade finished square feet
- Exterior features: Covered patio/porch; Deck; Porch; Back yard fencing (fenced); Level lot; Paved road
Interior
- Kitchen: Dishwasher; Disposal; Free-standing gas range; Free-standing refrigerator; Stainless steel appliances; Gas water heater
- Bedrooms: Total rooms: 7
- Bathrooms: 2 full bathrooms
- Heating & cooling: Central air conditioning; Forced air heating; Natural gas heating
- Interior features: High-speed internet; Therapeutic whirlpool
- Laundry & utility: Laundry room with washer hookup and gas dryer hookup; Washer; Dryer
Neighborhood map
What this means for you Summary
Snapshot
- This is a 4-bed/1.5-bath single-family listed at $299k.
Deal economics
- At list price, monthly cash flow is $-105 ($-1k/yr) — negative.
- To cash-flow at today's rent, offer at most $280k (6.2% below list).
- To meet the 1% rule (rent ≥ 1% of price), the offer needs to be $233k (21.9% below list).
- Recommended offer: $233k (21.9% below list) — sets the bar for 1% rule.
- Cap rate 5.9% vs local median 4.5% in Ferndale — meaningfully above typical; check what's discounted (condition, days-on-market, listing class) to confirm the premium yield is real.
Location & tenants
- Location reads 90/100 on livability (#8 in MI, #103 nationally) — a professional / high-income tenant draw. Strengths: amenities A+, commute A+, employment A+; Watch: schools D+.
- Ferndale Public Schools (suburban): math 18% / reading 39% proficiency, ranked #366 of 540 in MI (top 68%) — low school quality limits family demand, transient renter base, plan for 1-2y turnover.
- Market conditions: Rents rising fast (+6.2%/yr); 171 active listings in the ZIP; 12 comparable units currently listed for rent nearby; rentals at typical pace (median 22d on market — plan ~3-4 weeks tenant-placement turnaround); solid renter incomes; 2,614 units permitted in Oakland County in 2024 (721 in 5+ unit buildings).
- This rent runs 31% of the median local income ($90k/yr) — at the standard rent-burdened threshold; future hikes will face affordability resistance.
Forward outlook
- Local home prices are declining (-3.0%/yr); year-one equity from $2k of loan paydown is wiped out by about $9k of value loss. Plan a longer hold.
- Oakland County population projected at +10% by 2050 — modest demand growth; plan on rents tracking national, not racing it.
Negotiation context
- It's been on market 49 days — a 3% lower offer ($290k) is reasonable based on typical stale-listing flexibility.
- 8 sale attempts since 23y ago; this cycle's ask has dropped $30k (9%) from the opening price — seller is motivated, your offer sets the floor, not the list.
- Current owner paid $138k; list at $299k implies a 117% gain — meaningful room to come down on a strong offer.
Risks & watch-outs
- Watch-outs: built in 1938 — expect roof / HVAC / electrical / plumbing capex.
Questions for the listing agent
- What do current leases actually rent for vs. the listed asking? Can we see a recent rent roll and the last 12 months of T-12 income?
- It's been on market 49 days. Have you received any prior offers? Is the seller open to a 22% concession, seller financing, or rate buy-down credit?
- Built in 1938 — when were the roof, HVAC, electrical panel, plumbing, and water heater last replaced?
- Is there a deadline driving the sale (1031 exchange, divorce, estate, relocation)? That informs how much negotiation room exists.
- Schools are D-rated, which usually means shorter tenancies and higher turnover. Who's the typical renter profile here, and what's been the actual vacancy rate?
- The area grade is low — what's the realistic commute time and amenity access for the typical tenant pool here? Any planned neighborhood developments (good or bad) we should know about?
- What's the average days-on-market for RENTAL listings here right now (not sales)? A rising rental-DOM trend means longer vacancies and softer asking-rent achievability than the comps imply.
- What's the recent tenant-quality profile in this submarket — average credit score on applications, eviction rate, late-payment / NSF rate, and stable-employment percentage? A property-management company in the area should have these aggregated.
- How much new for-sale + rental construction is in the pipeline within 1–3 miles? Heavy new supply typically softens prices + rents 12–24 months out; constrained supply supports both.
Investment metrics
- 1% rule
- 0.78% ✗
- Cap rate
- 5.87%
- Cash-on-cash
- -1.50%
- DSCR
- 0.93
- GRM
- 10.7
CMA / ARV
- ARV (median comp)
- $321,271
- List price
- $299,000
- Delta
- -6.93%
- Verdict
- FAIR
- Comps
- 20 within 1.0 mi
Show comp detail 12 sales within ~0.75 mi
| Address | Dist | Beds/Ba | Sqft | Sold | Price | $/sf | Match |
|---|---|---|---|---|---|---|---|
| 370 Channing St | 0.47mi | 3/1.0 (-1) | 1,821 (-3%) | 2mo | $295,000 | $162 | 64 |
| 233 Silman St | 0.44mi | 3/2.0 (-1) | 1,970 (+5%) | 0mo | $382,000 | $194 | 64 |
| 621 W Hazelhurst St | 0.49mi | 4/2.5 | 1,758 (-6%) | 0mo | $475,000 | $270 | 63 |
| 1250 Orchard St | 0.65mi | 4/2.0 | 1,937 (+3%) | 0mo | $320,000 | $165 | 62 |
| 418 E Woodland St | 0.57mi | 3/2.0 (-1) | 1,815 (-3%) | 2mo | $360,000 | $198 | 60 |
| 770 Meadowdale St | 0.54mi | 3/1.0 (-1) | 1,779 (-5%) | 0mo | $260,000 | $146 | 59 |
| 923 Gardendale St | 0.55mi | 3/2.0 (-1) | 1,992 (+6%) | 0mo | $375,000 | $188 | 57 |
| 490 E Cambourne Dr | 0.39mi | 3/1.5 (-1) | 1,650 (-12%) | 2mo | $332,500 | $202 | 56 |
| 619 Withington St | 0.71mi | 4/2.0 | 1,971 (+5%) | 2mo | $425,000 | $216 | 55 |
| 1184 E Troy St | 0.60mi | 4/2.0 | 2,065 (+10%) | 2mo | $378,200 | $183 | 52 |
| 465 Pearson St | 0.37mi | 3/2.0 (-1) | 1,600 (-15%) | 1mo | $395,000 | $247 | 51 |
| 449 E Oakridge St | 0.72mi | 3/2.5 (-1) | 2,081 (+11%) | 0mo | $654,900 | $315 | 39 |
Match score weights: distance 35% · size 25% · config 20% · recency 20%. Top-matched comps best support the ARV.
Projected returns pro-forma
-3.0% appreciation · 6.24% rent growth · sell at horizon
- IRR
- -15.4%
- Equity multiple
- 0.43×
- Total profit
- $-47,318
- Equity at exit
- $44,582
- IRR
- -2.4%
- Equity multiple
- 0.81×
- Total profit
- $-15,505
- Equity at exit
- $25,852
Cash invested: $83,720 (down + closing). Projections, not guarantees.
Landlord ↔ Tenant lean methodology
- Overall (STATE)
- 62 Landlord-Friendly
- State Michigan
- 62 Landlord-Friendly · EVEN
- County
- — inherits STATE
- City
- — inherits STATE
ZIP-level market 48220
- Rents YoY
- 6.2%
- Active inventory
- 171
- Price-to-rent
- 10.7×
Monthly cashflow live
- Estimated rent
- $2,334 high interval (Pro) →
- Mortgage (P&I)
- −$1,568
- Tax from tax record
- −$256 /mo · $3,076/yr
- Insurance
- −$125
- HOA
- −$0
- Vacancy / Maint / Mgmt
- −$490
- Net cashflow
- $-105
Break-even live
UW: 25.0% down · 7.5% · 30yr · 1.5% tax · 5.0% vac · 8.0% maint · 8.0% mgmt
Financing live
Cash to close
- Down payment
- $74,750
- Closing costs
- $8,970
- Reserves months
- —
- Total cash needed
- —
Loan-product check · same deal, 3 products live
Conventional
25% down · 7.5% · 30yr
- Down + closing
- —
- Monthly P&I
- —
- Monthly cashflow
- —
- DSCR
- —
- Eligible?
- —
Personal DTI + credit; lowest rate.
DSCR
20% down · 8.5% · 30yr
- Down + closing
- —
- Monthly P&I
- —
- Monthly cashflow
- —
- DSCR
- —
- Eligible?
- —
No personal income docs; deal must DSCR.
Hard money
10% down · 12.0% · 12mo
- Down + closing
- —
- Monthly P&I
- —
- Monthly cashflow
- —
- DSCR
- —
- Eligible?
- —
Short-term bridge; refi at stabilization.
Rent comps 12 comps
| Address | Beds | Baths | Sqft | Rent | $/sqft | DOM | Units | Dist |
|---|---|---|---|---|---|---|---|---|
| 320 E Troy St Ferndale, MI | 4.0 | 2.0 | 1627 | $2,200 | $1.35 | 44d | 1 | 0.13mi |
| 351 Edgewood Pl Unit 2 Ferndale, MI | 3.0 | 2.0 | 1600 | $2,200 | $1.38 | 18d | 1 | 0.65mi |
| 2705 Inman St Ferndale, MI | 3.0 | 2.5 | 1429 | $3,195 | $2.24 | 2d | 1 | 0.74mi |
| 2803 Grayson St Ferndale, MI | 3.0 | 2.0 | 1274 | $2,000 | $1.57 | 44d | 1 | 0.81mi |
| 2554 Woodstock Dr Highland Park, MI | 3.0 | 1.5 | 1929 | $2,250 | $1.17 | 15d | 1 | 0.86mi |
| 631 Shasta Pl Ferndale, MI | 3.0 | 2.0 | 1317 | $2,100 | $1.59 | 44d | 1 | 0.98mi |
| 2186 Garfield St Ferndale, MI | 3.0 | 1.0 | 1300 | $1,750 | $1.35 | 24d | 1 | 1.14mi |
| 1330 E Chesterfield St Ferndale, MI | 4.0 | 2.0 | 1795 | $2,800 | $1.56 | 2d | 1 | 1.15mi |
| 2420 Woodward Hts Ferndale, MI | 3.0 | 1.0 | 1316 | $2,200 | $1.67 | 24d | 1 | 1.15mi |
| 1557 Leroy St Ferndale, MI | 3.0 | 2.0 | 1380 | $2,523 | $1.83 | 5d | 1 | 1.21mi |
| 1414 Owana Ave Royal Oak, MI | 3.0 | 1.0 | 1489 | $1,675 | $1.12 | 22d | 1 | 1.38mi |
| 329 W Muir Ave Hazel Park, MI | 4.0 | 2.0 | 1606 | $2,000 | $1.25 | 11d | 1 | 1.38mi |
Listing history 37 events
-
2026-06-18days on market $299,000 Active 49 DOM
-
2026-06-17days on market $299,000 Active 48 DOM
-
2026-06-16days on market $299,000 Active 47 DOM
-
2026-06-15days on market $299,000 Active 46 DOM
-
2026-06-13days on market $299,000 Active 44 DOM
-
2026-06-13days on market $299,000 Active 43 DOM
-
2026-06-09days on market $299,000 Active 40 DOM
-
2026-06-08days on market $299,000 Active 39 DOM
-
2026-06-07days on market $299,000 Active 38 DOM
-
2026-06-04days on market $299,000 Active 35 DOM
-
2026-06-03days on market $299,000 Active 34 DOM
-
2026-06-02days on market $299,000 Active 33 DOM
-
2026-06-01days on market $299,000 Active 32 DOM
-
2026-05-31days on market $299,000 Active 31 DOM
-
2026-04-30$329,000 Active 966-char remark
Show marketing remark (999 chars)
Welcome home! Great location close to downtown Ferndale and all the activities that this vibrant town offers. Charming Cape Cod offers a large updated kitchen with upgraded appliances. Quality cabinets with custom granite counters and backsplash. Spacious dining room with natural wood flooring. Relaxing living room with hardwood flooring. The primary first-floor bedroom is large with hardwood flooring. Luxurious first-floor bathroom features a step-in jetted garden tub plus a full standalone walk-in shower. Enjoy the spacious upper 2 bedrooms with built-in bench seating and a beautiful remodeled full bathroom. Updated windows, newer driveway, newer custom vinyl privacy fence, and much more. Attractive private backyard with a convenient shed and entertaining-sized deck make for enjoyable, relaxing days. You will enjoy all the great restaurants, shops, breweries, theater, and live activities. Don't miss this one, plus a 1 Year Home Warranty. Note: New AC condensing unit being installed.
-
2008-08-01soldstatus $137,500
-
2008-07-24soldstatus $137,500
Show marketing remark (407 chars)
DELIGHTFUL BUNGALOW - TASTEFULLY UPDATED THROUGHOUT. KIT W/ TRAVERTINE FLRS, GARDEN WINDOW, STONE COUNTERS. 1ST FLR MSTR SUITE, BATH W/ NEW & FANTASTIC TUB, SHOWER & SINK. NEW WALNUT INT DRS, NEW ROOF (1 YR), COPPER PLUMBING AND A SPRINKLER SYSTEM. 2ND NEW FULL BATH WITH FLAIR ON THE 2ND FLR & PART FIN BSMT. SELLERS WILL PAY FOR LAWNCARE FOR THE ENTIRE SUMMER-WHAT A BONUS. GREAT YARD.
-
2008-04-15$149,900
Show marketing remark (407 chars)
DELIGHTFUL BUNGALOW - TASTEFULLY UPDATED THROUGHOUT. KIT W/ TRAVERTINE FLRS, GARDEN WINDOW, STONE COUNTERS. 1ST FLR MSTR SUITE, BATH W/ NEW & FANTASTIC TUB, SHOWER & SINK. NEW WALNUT INT DRS, NEW ROOF (1 YR), COPPER PLUMBING AND A SPRINKLER SYSTEM. 2ND NEW FULL BATH WITH FLAIR ON THE 2ND FLR & PART FIN BSMT. SELLERS WILL PAY FOR LAWNCARE FOR THE ENTIRE SUMMER-WHAT A BONUS. GREAT YARD.
-
2008-04-10historical
-
2008-04-10historical
-
2008-03-12$159,999
-
2008-03-12$159,999
-
2008-03-11historical
-
2007-10-10$159,999
-
2003-09-17soldstatus $152,913
-
2003-06-30soldstatus $152,913
-
2003-06-30soldstatus $152,913
-
2003-05-11historical
-
2003-04-16$155,000
-
2003-01-02$155,000
-
2000-06-05soldstatus $118,000
-
1999-06-24soldstatus $65,000
-
1996-06-11soldstatus $44,000
-
1994-11-01soldstatus $32,000
-
1994-11-01soldstatus $48,000
-
1986-09-01soldstatus $32,000
ⓘ Source: listings_history table (triggers on properties + properties_extension) + one-shot
backfill from property_details.listing_events for pre-trigger history.
Tax reassessment forecast MI · Partial reset (capped growth)
- Current annual tax
- $3,076 · $256/mo
- Projected year-2 tax
- $3,840 · $320/mo
- Expected delta
- +$764/yr (+$64/mo · 24.8%)
ⓘ Screening estimate from a state-policy table — verify with the county assessor before closing.
Climate risk First Street
- Flood 1/10 Low FEMA zone X (unshaded) · 0% chance over 30 yrs
- Wildfire 1/10 Low
- Heat 3/10 Moderate 7 d/yr ≥97°F today · 15 d/yr by 30 yrs out
- Wind 2/10 Low
- Air quality 3/10 Moderate 3 unhealthy d/yr today · 5 by 30 yrs out
Nearby sold comps map
Loading sold comps map…
Walkable amenities ~0.75 mi
Loading nearby amenities…
Taxation est. · year 1
- Rental income
- $28,009
- − Mortgage interest
- −$16,749
- − Property taxes
- −$3,076
- − Insurance
- −$1,495
- − Repairs & maintenance
- −$2,241
- − Management
- −$2,241
- − Depreciation
- −$8,698
- Taxable loss
- −$6,490
- Est. tax savings @ 24.0%
- +$1,558
- After-tax cash flow
- $298/yr
For passive investors: Depreciation is non-cash, so a rental often shows a tax loss while cash-flowing — sheltering income. Rental losses are passive: they offset passive income freely, and up to $25,000/yr can offset ordinary (W-2) income if you actively participate and your MAGI is under $100k (phasing out to $0 by $150k); unused losses carry forward. On sale, claimed depreciation is recaptured at up to 25%, and gains may owe capital-gains tax (a 1031 exchange can defer both). Figures are a year-1 estimate at your 24.0% rate — not tax advice; consult a CPA.
Schools (NCES district)
- District
- Ferndale Public Schools
- NCES district ID
- 2614280
- Math proficiency
- 18% ▼ -3.00%
- Reading proficiency
- 39% ▲ 5.00%
- Median HH income
- $56,069
- Composite
- 25.46/100
- National rank
- #7449
- State rank
- #366 of 540 in MI
Livability — Ferndale
- Score
- 90/100
- State rank
- #8
- US rank
- #103
Category grades
Schools grade is shown separately in the Schools card above.
Census & demographics
- Census place
- Ferndale, MI
- County
- Oakland County · 1,009,092 people
- City population
- 21,527
- Metro
- Detroit-Warren-Dearborn, MI
- Population (ZIP)
- 21,527
- Household income
- $89,881
- Rent vs Own
- Severe rent burden
- 670.0
Population outlook (Oakland County) Hauer SSP2
- Today (2025)
- 1,335,747 people
- By 2030
- 1,375,100 · +2.9%
- By 2040
- 1,435,385 · +7.5%
- By 2050
- 1,469,250 · +10.0%
- By 2075
- 1,531,946 · +14.7%
- By 2100
- 1,450,485 · +8.6%
Race, ethnicity, and origin ACS 2023
- Neighborhood character
- Predominantly White (72%)
- Race & ethnicity
- White 72% Black 15% Two or more races 6% Hispanic / Latino 5% Asian 3%
- Common ancestry
- Romanian 11% Lithuanian 6% Slovak 3%
- Foreign-born
- 4% · Canada, South Korea
- Languages at home
- 95% English-only · Spanish 2% Other Indo-European 1% German/W. Germanic 1%
Political lean MEDSL · Oakland
- 2024 margin
- D (+10.6) · D 54.4% · R 43.8% · Other 1.9%
- 2008→2024 swing
- -3.9pp toward R · 2008: 14.5pp · 2024: 10.6pp
- All cycles
- 2024: D+10.6 2020: D+14.1 2016: D+8.1 2012: D+8.1 2008: D+14.5
Not yet ingested
- Civics
- —
Market trends
- HPI YoY
- ▼ -394.92%
- Current HPI
- 273.0986
- Rent YoY
- ▲ 6.24%
- Metro
- Detroit-Warren-Dearborn, MI
- State GDP YoY
- ▲ 1.37%
- F500 in state
- 28
Industry mix (Fortune 500 HQ in MI)
| Industry | F500 HQs | Revenue |
|---|---|---|
| Automotive Parts | 3 | $48B |
|
||
| Automotive | 2 | $372B |
|
||
| Chemicals | 1 | $45B |
|
||
| Automotive Retail | 1 | $29B |
|
||
| Healthcare / Medical Devices | 1 | $23B |
|
||
| Automotive Technology | 1 | $20B |
|
||
Price history
+834.4% since first listed25 events — show timeline
- 2026-05-24 Price Changed $299,000 MiRealSource-MiMLS
- 2026-05-23 Price Changed $299,000 REALCOMP
- 2026-04-30 Listed $329,000 REALCOMP
- 2026-04-30 Listed $329,000 MiRealSource-MiMLS
- 2008-08-01 Sold (Public Records) $137,500 Public Records
- 2008-07-24 Sold (MLS) $137,500 REALCOMP
- 2008-04-15 Listed $149,900 REALCOMP
- 2008-04-10 Listing Removed — REALCOMP
- 2008-04-10 Listing Removed — MiRealSource-MiMLS
- 2008-03-12 Listed $159,999 REALCOMP
- 2008-03-12 Listed $159,999 MiRealSource-MiMLS
- 2008-03-11 Listing Removed — REALCOMP
- 2007-10-10 Listed $159,999 REALCOMP
- 2003-09-17 Sold (Public Records) $152,913 Public Records
- 2003-06-30 Sold (MLS) $152,913 MiRealSource-MiMLS
- 2003-06-30 Sold (MLS) $152,913 REALCOMP
- 2003-05-11 Listing Removed — MiRealSource-MiMLS
- 2003-04-16 Listed $155,000 MiRealSource-MiMLS
- 2003-01-02 Listed $155,000 REALCOMP
- 2000-06-05 Sold (Public Records) $118,000 Public Records
- 1999-06-24 Sold (Public Records) $65,000 Public Records
- 1996-06-11 Sold (Public Records) $44,000 Public Records
- 1994-11-01 Sold (Public Records) $48,000 Public Records
- 1994-11-01 Sold (Public Records) $32,000 Public Records
- 1986-09-01 Sold (Public Records) $32,000 Public Records
Property tax history
+1.8%/yrLatest (2025): $3,076 · +2.1% YoY. Source: county tax records.
Cash-flow waterfall
monthlySold comps — $/sqft
last 12 mo · ≤1 miLoading sold comps…