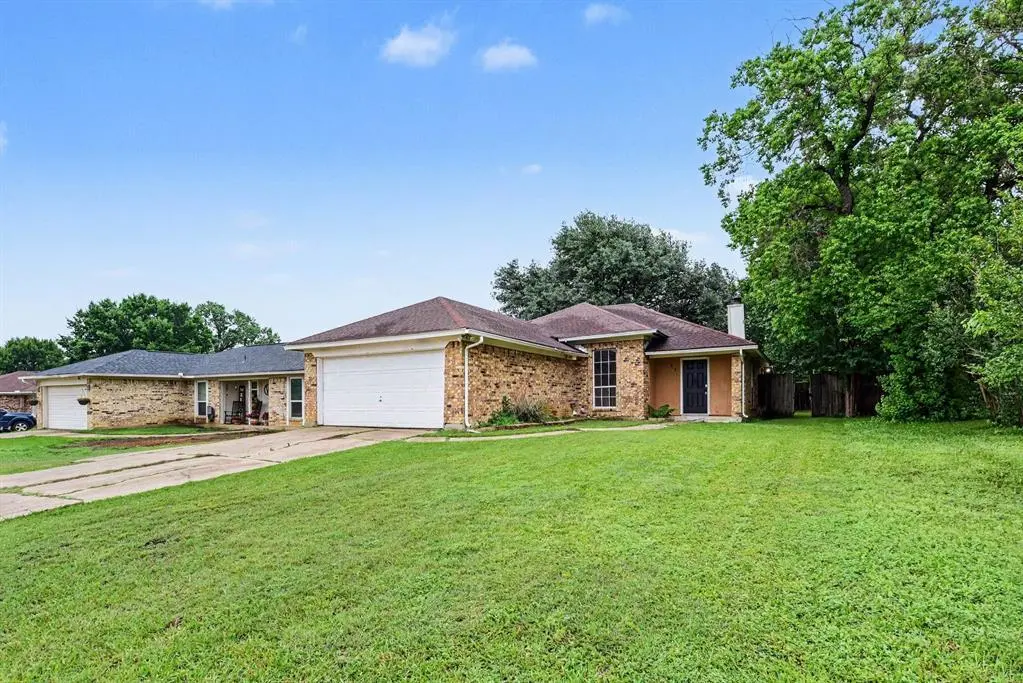
313 Sunnyview Dr
Mansfield, TX 76063
$184,900C+
3 bd · 2.0 ba ·
1,308 sqft ·
Built 1984
· SingleFamily
· Pending
· 17 DOM
Cashflow @ list (25.0% down · 7.5%)
Estimated rent
$2,153/mo
Mortgage (P&I)
−$970
Tax + insurance
−$431
HOA
−$0
Vac / Maint / Mgmt
−$452
Net cashflow
$300/mo
Annual
$3,601/yr
Cap rate
8.24%
Cash-on-cash
6.95%
DSCR
1.31
1% rule
1.16%
Cash to close
$51,772
Investor read
- This is a 3-bed/2.0-bath single-family listed at $185k.
- At list price, monthly cash flow is $300 ($4k/yr) — positive.
- The deal already cash-flows at list — no discount required.
- Meets the 1% rule at list price ($2k rent vs $185k).
- It's been on market 17 days — a 2% lower offer ($182k) is reasonable based on typical stale-listing flexibility.
- Recommended offer: $182k (1.5% below list) — sets the bar for market timing.
- Local home prices are declining (-3.0%/yr); year-one equity from $1k of loan paydown is wiped out by about $6k of value loss. Plan a longer hold.
- Location reads 72/100 on livability (#243 in TX) — a middle-class / working-renter tenant base. Strengths: employment A+, housing A+, crime A; Watch: amenities F, commute F, health & safety D-.
- Mansfield ISD (suburban): math 47% / reading 53% proficiency, ranked #125 of 826 in TX (top 15%) — acceptable for families but not a draw, mixed tenant base, ~2y average lease.
- Zoned schools: Erma Nash El (math 27% / reading 36%, grade F, #2,396 of 4,322 statewide, top 56%, 662 students, 65% FRL) — zoned schools average 65% FRL vs 35% district-wide (30 pts higher); higher-poverty schools than district average — tighter screening recommended.
- Zoned-school proficiency averages 32% at this address vs 50% district-wide (-18 pts) — the specific schools serving this property underperform the Mansfield ISD average; the district grade overstates school quality for this exact location.
- Market conditions: Rents soft (-1.2%/yr); 715 active listings in the ZIP; 34 comparable units currently listed for rent nearby; rentals leasing fast (median 13d on market — plan ~1-2 weeks tenant-placement turnaround); high-income renter base; 18,938 units permitted in Tarrant County in 2024 (8,336 in 5+ unit buildings).
- Tarrant County population projected at +41% by 2050 — long-run rental-demand tailwind backs the buy-and-hold thesis.
- Climate carrying-cost: major wind risk, 27% chance of damaging wind over 30y; extreme-heat days projected 7→23/yr by 2055 (HVAC capex compounding) — expect insurance premiums to compound above CPI over the hold.
- Cap rate 8.2% vs local median 2.8% in Mansfield — top-decile yield for the area; either an underpriced asset or a hidden risk that comps aren't pricing in. Stress-test before assuming the spread holds.
Questions for listing agent
- Is there a deadline driving the sale (1031 exchange, divorce, estate, relocation)? That informs how much negotiation room exists.
- Schools are A-rated — typically a magnet for longer-tenancy family renters. What's the average tenant stay here, and is there a school-zone premium baked into asking?
- What's the average days-on-market for RENTAL listings here right now (not sales)? A rising rental-DOM trend means longer vacancies and softer asking-rent achievability than the comps imply.
- What's the recent tenant-quality profile in this submarket — average credit score on applications, eviction rate, late-payment / NSF rate, and stable-employment percentage? A property-management company in the area should have these aggregated.
- How much new for-sale + rental construction is in the pipeline within 1–3 miles? Heavy new supply typically softens prices + rents 12–24 months out; constrained supply supports both.
CashFlowRE · CFR-CDQ0YAARY50XV8
· Data 3 weeks ago
cashflowre.app · 2026-05-29