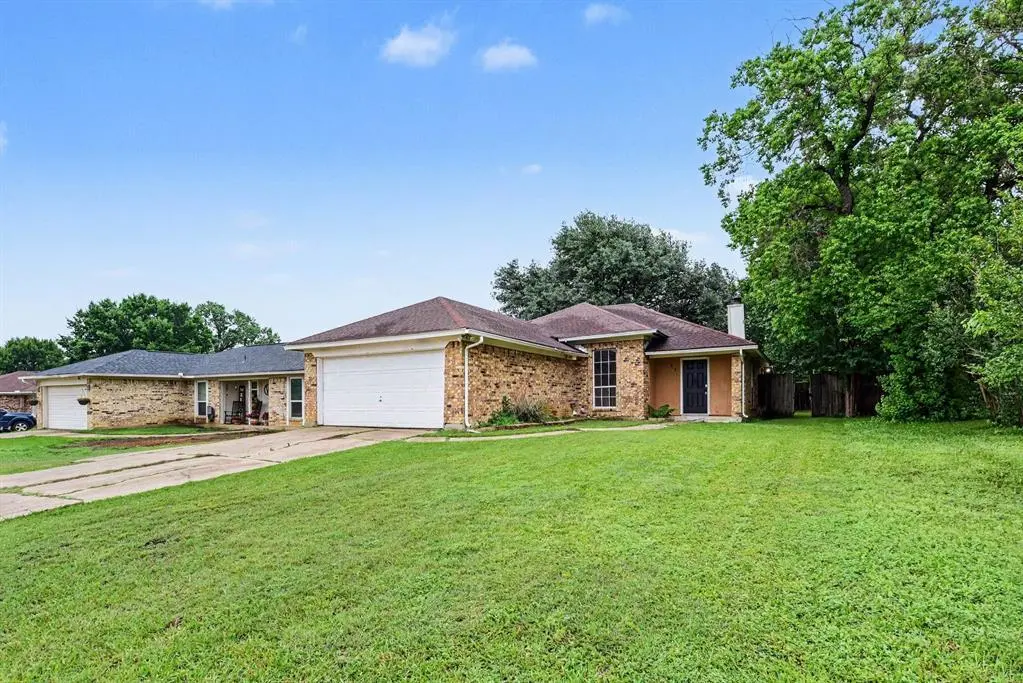
313 Sunnyview Dr · Mansfield, TX
Flood risk 1/10 · Minimal
- FEMA flood zone
- X (unshaded)
- Chance of flooding over 30 yrs
- 0.0%
- Est. flood insurance / yr
- $507 – $1,088
Fire risk 4/10 · Minor
- Est. fire insurance / yr
- $1,222 – $2,270
Heat risk 7/10 · Major
- Hot days now (above 110°F)
- 7 days/yr
- Hot days in 30 yrs
- 23 days/yr
Wind risk 6/10 · Moderate
- Chance of severe wind over 30 yrs
- 27.0%
Air-quality risk 3/10 · Minor
- Unhealthy air days now
- 2 days/yr
- Unhealthy air days in 30 yrs
- 3 days/yr
Risk factors via First Street. Map © Google.
Why this score? — see what drove the C+ grade
The composite is a weighted blend of 9 inputs, each scored 0–100. Each bar is that input's sub-score; the figure is the points it added to the 100-point composite (weight × sub-score).
- Cash flow +22.2/30.0
- ARV discount +15.0/15.0
- DSCR +7.1/10.0
- 1% rule +6.6/10.0
- Schools +4.6/10.0
- Livability +3.6/5.0
- Condition / age +2.5/5.0
- Rent growth +2.2/5.0
- Appreciation +0.0/10.0
$184,900
🖨 Deal sheet 📄 Offer letter ✓ Due diligence
Listing remarks
Unlock the potential in this 3-bedroom, 2-bathroom single-family home located in the established Hillcrest West community of Mansfield. Spanning approximately 1,308 square feet, this 1984-built brick residence serves as a blank slate for those looking to customize or renovate. Situated on a generous 7,262-square-foot lot within the highly regarded Mansfield ISD, the property offers a functional layout and a spacious backyard. Conveniently located near local parks and downtown Mansfield shopping. Bring your vision and transform this project into a standout home. Schedule your tour today!
Key facts
- Generous lot
- Spacious backyard
- Mansfield isd
Tags
Property features AI
Finance
- Other: Pet restrictions apply
- Financial info: Listing terms include Cash, Conventional, FHA, VA Loan
- HOA & community: No homeowner association
Exterior
- Parking: Attached garage; 2 covered garage spaces (approx. 20' wide x 20' long)
- Utilities: Underground utilities; Not in a municipal utility district
- Home design: Single family residence; One story; Residential property
- Construction: Brick construction; Shingle/composition roof; Slab foundation; Built in 1984
- Exterior features: Fenced yard; Patio
Interior
- Kitchen: Dishwasher; Disposal; Microwave; Refrigerator; Electric water heater
- Bedrooms: Primary bedroom on level 1 (approx. 11 x 12); Bedroom on level 1 (approx. 10 x 10); Bedroom on level 1 (approx. 10 x 10)
- Flooring: Carpet; Laminate
- Bathrooms: 2 full bathrooms
- Heating & cooling: Central heating (Natural Gas); Central air (Electric)
- Interior features: Built-in features; Walk-in closet(s); One living area; One dining area; Total room count: 8; Living room with fireplace
- Laundry & utility: Laundry room on level 1 (approx. 6 x 5); Laundry features: Other
Neighborhood map
What this means for you Summary
Snapshot
- This is a 3-bed/2.0-bath single-family listed at $185k.
Deal economics
- At list price, monthly cash flow is $300 ($4k/yr) — positive.
- The deal already cash-flows at list — no discount required.
- Meets the 1% rule at list price ($2k rent vs $185k).
- Recommended offer: $182k (1.5% below list) — sets the bar for market timing.
- Cap rate 8.2% vs local median 2.8% in Mansfield — top-decile yield for the area; either an underpriced asset or a hidden risk that comps aren't pricing in. Stress-test before assuming the spread holds.
Location & tenants
- Location reads 72/100 on livability (#243 in TX) — a middle-class / working-renter tenant base. Strengths: employment A+, housing A+, crime A; Watch: amenities F, commute F, health & safety D-.
- Mansfield ISD (suburban): math 47% / reading 53% proficiency, ranked #125 of 826 in TX (top 15%) — acceptable for families but not a draw, mixed tenant base, ~2y average lease.
- Zoned schools: Erma Nash El (math 27% / reading 36%, grade F, #2,396 of 4,322 statewide, top 56%, 662 students, 65% FRL) — zoned schools average 65% FRL vs 35% district-wide (30 pts higher); higher-poverty schools than district average — tighter screening recommended.
- Zoned-school proficiency averages 32% at this address vs 50% district-wide (-18 pts) — the specific schools serving this property underperform the Mansfield ISD average; the district grade overstates school quality for this exact location.
- Market conditions: Rents soft (-1.2%/yr); 715 active listings in the ZIP; 34 comparable units currently listed for rent nearby; rentals leasing fast (median 13d on market — plan ~1-2 weeks tenant-placement turnaround); high-income renter base; 18,938 units permitted in Tarrant County in 2024 (8,336 in 5+ unit buildings).
Forward outlook
- Local home prices are declining (-3.0%/yr); year-one equity from $1k of loan paydown is wiped out by about $6k of value loss. Plan a longer hold.
- Tarrant County population projected at +41% by 2050 — long-run rental-demand tailwind backs the buy-and-hold thesis.
Negotiation context
- It's been on market 17 days — a 2% lower offer ($182k) is reasonable based on typical stale-listing flexibility.
Risks & watch-outs
- Climate carrying-cost: major wind risk, 27% chance of damaging wind over 30y; extreme-heat days projected 7→23/yr by 2055 (HVAC capex compounding) — expect insurance premiums to compound above CPI over the hold.
Questions for the listing agent
- Is there a deadline driving the sale (1031 exchange, divorce, estate, relocation)? That informs how much negotiation room exists.
- Schools are A-rated — typically a magnet for longer-tenancy family renters. What's the average tenant stay here, and is there a school-zone premium baked into asking?
- What's the average days-on-market for RENTAL listings here right now (not sales)? A rising rental-DOM trend means longer vacancies and softer asking-rent achievability than the comps imply.
- What's the recent tenant-quality profile in this submarket — average credit score on applications, eviction rate, late-payment / NSF rate, and stable-employment percentage? A property-management company in the area should have these aggregated.
- How much new for-sale + rental construction is in the pipeline within 1–3 miles? Heavy new supply typically softens prices + rents 12–24 months out; constrained supply supports both.
Investment metrics
- 1% rule
- 1.16% ✓
- Cap rate
- 8.24%
- Cash-on-cash
- 6.95%
- DSCR
- 1.31
- GRM
- 7.2
CMA / ARV
- ARV (median comp)
- $244,214
- List price
- $184,900
- Delta
- -24.29%
- Verdict
- UNDERPRICED
- Comps
- 20 within 1.0 mi
Show comp detail 12 sales within ~0.75 mi
| Address | Dist | Beds/Ba | Sqft | Sold | Price | $/sf | Match |
|---|---|---|---|---|---|---|---|
| 313 Sunnyview Dr | 0.00mi | 3/2.0 | 1,308 (0%) | 0mo | $184,900 | $141 | 100 |
| 420 Hillcrest St | 0.28mi | 3/2.0 | 1,325 (+1%) | 2mo | $289,000 | $218 | 82 |
| 400 Mckown Dr | 0.11mi | 3/1.5 | 1,404 (+7%) | 3mo | $239,900 | $171 | 78 |
| 1008 Kay Lynn St | 0.31mi | 3/2.0 | 1,240 (-5%) | 1mo | $315,000 | $254 | 76 |
| 605 Plainview Dr | 0.22mi | 3/2.0 | 1,220 (-7%) | 3mo | $270,000 | $221 | 76 |
| 505 Blueberry Hill Ln | 0.23mi | 3/2.0 | 1,446 (+11%) | 4mo | $285,000 | $197 | 69 |
| 625 Little Ln | 0.40mi | 3/2.0 | 1,432 (+10%) | 3mo | $255,000 | $178 | 63 |
| 1007 Kay Lynn St | 0.31mi | 3/2.0 | 1,501 (+15%) | 3mo | $284,900 | $190 | 58 |
| 106 S 3rd Ave | 0.69mi | 3/2.0 | 1,369 (+5%) | 2mo | $315,000 | $230 | 58 |
| 606 Hillcrest St | 0.36mi | 3/2.0 | 1,503 (+15%) | 0mo | $275,000 | $183 | 58 |
| 649 Blueberry Hill Ln | 0.49mi | 3/2.0 | 1,441 (+10%) | 3mo | $250,000 | $173 | 58 |
| 1094 Palm Ct | 0.74mi | 3/2.0 | 1,380 (+6%) | 2mo | $313,500 | $227 | 55 |
Match score weights: distance 35% · size 25% · config 20% · recency 20%. Top-matched comps best support the ARV.
Projected returns pro-forma
-3.0% appreciation · 0.0% rent growth · sell at horizon
- IRR
- -9.3%
- Equity multiple
- 0.67×
- Total profit
- $-17,053
- Equity at exit
- $27,569
- IRR
- -4.9%
- Equity multiple
- 0.73×
- Total profit
- $-14,188
- Equity at exit
- $15,987
Cash invested: $51,772 (down + closing). Projections, not guarantees.
Landlord ↔ Tenant lean methodology
- Overall (STATE)
- 87 Strongly Landlord-Friendly
- State Texas
- 87 Strongly Landlord-Friendly · R+5
- County
- — inherits STATE
- City
- — inherits STATE
ZIP-level market 76063
- Home prices YoY
- -29.5%
- Rents YoY
- -1.2%
- Active inventory
- 715
- Price-to-rent
- 7.2×
Monthly cashflow live
- Estimated rent
- $2,153 high interval (Pro) →
- Mortgage (P&I)
- −$970
- Tax from tax record
- −$354 /mo · $4,252/yr
- Insurance
- −$77
- HOA
- −$0
- Vacancy / Maint / Mgmt
- −$452
- Net cashflow
- $300
Break-even live
UW: 25.0% down · 7.5% · 30yr · 1.5% tax · 5.0% vac · 8.0% maint · 8.0% mgmt
Financing live
Cash to close
- Down payment
- $46,225
- Closing costs
- $5,547
- Reserves months
- —
- Total cash needed
- —
Loan-product check · same deal, 3 products live
Conventional
25% down · 7.5% · 30yr
- Down + closing
- —
- Monthly P&I
- —
- Monthly cashflow
- —
- DSCR
- —
- Eligible?
- —
Personal DTI + credit; lowest rate.
DSCR
20% down · 8.5% · 30yr
- Down + closing
- —
- Monthly P&I
- —
- Monthly cashflow
- —
- DSCR
- —
- Eligible?
- —
No personal income docs; deal must DSCR.
Hard money
10% down · 12.0% · 12mo
- Down + closing
- —
- Monthly P&I
- —
- Monthly cashflow
- —
- DSCR
- —
- Eligible?
- —
Short-term bridge; refi at stabilization.
Rent comps 34 comps
| Address | Beds | Baths | Sqft | Rent | $/sqft | DOM | Units | Dist |
|---|---|---|---|---|---|---|---|---|
| 313 Hillcrest St Mansfield, TX | 4.0 | 1.5 | 1600 | $3,000 | $1.88 | 43d | 1 | 0.21mi |
| 309 Hillcrest St Mansfield, TX | 3.0 | 2.0 | 1300 | $1,950 | $1.50 | 43d | 1 | 0.22mi |
| 606 Plainview Dr Mansfield, TX | 2.0 | 2.0 | 1246 | $1,881 | $1.51 | 12d | 1 | 0.23mi |
| 500 E Kimball St Unit 1 Mansfield, TX | 3.0 | 2.5 | 1527 | $2,295 | $1.50 | 7d | 1 | 0.26mi |
| 305 Live Oak Dr Mansfield, TX | 4.0 | 2.0 | 1320 | $2,000 | $1.52 | 43d | 1 | 0.28mi |
| 311 Stell Ave Mansfield, TX | 3.0 | 2.0 | 1484 | $2,190 | $1.48 | 12d | 1 | 0.29mi |
| 609 Blueberry Hill Ln Mansfield, TX | 3.0 | 2.0 | 1796 | $2,195 | $1.22 | 12d | 1 | 0.30mi |
| 608 Hillcrest St Mansfield, TX | 3.0 | 2.0 | 1282 | $1,800 | $1.40 | 3d | 1 | 0.36mi |
| 621 Hollyberry Dr Mansfield, TX | 3.0 | 2.0 | 1152 | $2,180 | $1.89 | 3d | 1 | 0.38mi |
| 625 Hollyberry Dr Mansfield, TX | 3.0 | 2.0 | 1303 | $2,150 | $1.65 | 18d | 1 | 0.39mi |
| 627 McKown Dr Mansfield, TX | 3.0 | 2.0 | 1377 | $2,000 | $1.45 | 24d | 1 | 0.45mi |
| 800 Fort Worth St Mansfield, TX | 3.0 | 2.0 | 1383 | $1,875 | $1.36 | 43d | 1 | 0.46mi |
| 649 Blueberry Hill Ln Mansfield, TX | 3.0 | 2.0 | 1441 | $2,075 | $1.44 | 2d | 1 | 0.47mi |
| 906 Fort Worth St Mansfield, TX | 3.0 | 2.0 | 1383 | $2,051 | $1.48 | 7d | 1 | 0.48mi |
| 609 Kings Way Dr Unit A Mansfield, TX | 3.0 | 2.0 | 1064 | $1,800 | $1.69 | 43d | 1 | 0.53mi |
| 307 Kings Way Dr Mansfield, TX | 3.0 | 2.0 | 1220 | $1,790 | $1.47 | 24d | 1 | 0.53mi |
| 303 Kings Way Dr Unit B Mansfield, TX | 2.0 | 2.0 | 1064 | $2,200 | $2.07 | 2d | 1 | 0.54mi |
| 502 W Kimball St Unit 2 Mansfield, TX | 3.0 | 2.5 | 1513 | $2,295 | $1.52 | 24d | 1 | 0.75mi |
| 506 W Kimball St Unit 1 Mansfield, TX | 3.0 | 2.5 | 1526 | $2,295 | $1.50 | 24d | 1 | 0.77mi |
| 506 W Kimball St Unit 2 Mansfield, TX | 3.0 | 2.5 | 1526 | $2,395 | $1.57 | 43d | 1 | 0.77mi |
| 508 W Kimball St Unit 1 Mansfield, TX | 3.0 | 2.5 | 1723 | $2,495 | $1.45 | 7d | 1 | 0.78mi |
| 223 N Willow St Mansfield, TX | 3.0 | 2.0 | 1304 | $2,150 | $1.65 | 20d | 1 | 0.82mi |
| 1302 Palm St Mansfield, TX | 3.0 | 2.0 | 1574 | $2,300 | $1.46 | 43d | 1 | 0.89mi |
| 214 Juniper St Mansfield, TX | 3.0 | 2.0 | 1610 | $2,250 | $1.40 | 43d | 1 | 0.90mi |
| 15 Foster Ct Mansfield, TX | 2.0 | 2.0 | 950 | $1,400 | $1.47 | 24d | 1 | 0.95mi |
| 715 N Main St Mansfield, TX | 1.0–3.0 | 1.0–2.0 | 1022 | $2,533 | $2.48 | 1d | 18 | 0.97mi |
| 302 Shady Valley Dr Mansfield, TX | 2.0 | 2.0 | 1032 | $1,650 | $1.60 | 18d | 1 | 1.02mi |
| 751 N Main St Mansfield, TX | 1.0–3.0 | 1.0–2.0 | 1032 | $2,609 | $2.53 | 1d | 19 | 1.04mi |
| 925 Remington Ranch Rd Mansfield, TX | 3.0 | 2.0 | 1524 | $2,350 | $1.54 | 12d | 1 | 1.31mi |
| 910 Blue Jay Dr Mansfield, TX | 3.0 | 2.0 | 1409 | $2,250 | $1.60 | 2d | 1 | 1.32mi |
| 1002 Canary Ln Mansfield, TX | 3.0 | 2.0 | 1373 | $2,250 | $1.64 | 7d | 1 | 1.38mi |
| 5 Canary Ct Mansfield, TX | 3.0 | 2.0 | 1579 | $1,995 | $1.26 | 3d | 1 | 1.38mi |
| 1400 North St Mansfield, TX | 1.0–3.0 | 1.0–2.0 | 964 | $2,413 | $2.50 | 1d | 28 | 1.39mi |
| 1725 E Broad St Mansfield, TX | 3.0 | 1.0–2.0 | 1016 | $2,995 | $2.95 | 1d | 265 | 1.49mi |
Listing history 4 events
-
2026-05-18status Pending 593-char remark
-
2026-05-01$184,900 Active 593-char remark
-
2014-06-17soldstatus
-
1994-01-05soldstatus
ⓘ Source: listings_history table (triggers on properties + properties_extension) + one-shot
backfill from property_details.listing_events for pre-trigger history.
Tax reassessment forecast TX · Resets to sale price
- Current annual tax
- $4,252 · $354/mo
- Projected year-2 tax
- $4,252 · $354/mo
- Expected delta
- $0/yr ($0/mo · 0.0%)
ⓘ Screening estimate from a state-policy table — verify with the county assessor before closing.
Climate risk First Street
- Flood 1/10 Low FEMA zone X (unshaded) · 0% chance over 30 yrs
- Wildfire 4/10 Moderate
- Heat 7/10 Severe 7 d/yr ≥110°F today · 23 d/yr by 30 yrs out
- Wind 6/10 Major 27% chance of damaging wind over 30 yrs
- Air quality 3/10 Moderate 2 unhealthy d/yr today · 3 by 30 yrs out
Nearby sold comps map
Loading sold comps map…
Walkable amenities ~0.75 mi
Loading nearby amenities…
Taxation est. · year 1
- Rental income
- $25,839
- − Mortgage interest
- −$10,357
- − Property taxes
- −$4,252
- − Insurance
- −$924
- − Repairs & maintenance
- −$2,067
- − Management
- −$2,067
- − Depreciation
- −$5,379
- Taxable income
- $792
- Est. tax owed @ 24.0%
- −$190
- After-tax cash flow
- $3,411/yr
For passive investors: Depreciation is non-cash, so a rental often shows a tax loss while cash-flowing — sheltering income. Rental losses are passive: they offset passive income freely, and up to $25,000/yr can offset ordinary (W-2) income if you actively participate and your MAGI is under $100k (phasing out to $0 by $150k); unused losses carry forward. On sale, claimed depreciation is recaptured at up to 25%, and gains may owe capital-gains tax (a 1031 exchange can defer both). Figures are a year-1 estimate at your 24.0% rate — not tax advice; consult a CPA.
Schools (NCES district)
- District
- Mansfield ISD
- NCES district ID
- 4828920
- Math proficiency
- 47% ▼ -17.00%
- Reading proficiency
- 53% ▼ -6.00%
- Median HH income
- $81,934
- Composite
- 45.82/100
- National rank
- #2558
- State rank
- #125 of 826 in TX
Livability — Mansfield
- Score
- 72/100
- State rank
- #243
- US rank
- #5833
Category grades
Schools grade is shown separately in the Schools card above.
Census & demographics
- Census place
- Mansfield, TX
- County
- Tarrant County · 2,033,669 people
- City population
- 82,625
- Metro
- Dallas-Fort Worth-Arlington, TX
- Population (ZIP)
- 82,625
- Household income
- $118,946
- Rent vs Own
- Severe rent burden
- 2081.0
Population outlook (Tarrant County) Hauer SSP2
- Today (2025)
- 2,380,417 people
- By 2030
- 2,578,900 · +8.3%
- By 2040
- 2,974,995 · +25.0%
- By 2050
- 3,350,489 · +40.8%
- By 2075
- 4,216,909 · +77.2%
- By 2100
- 4,741,527 · +99.2%
Race, ethnicity, and origin ACS 2023
- Neighborhood character
- Diverse neighborhood (Simpson 0.65)
- Race & ethnicity
- White 52% Black 22% Hispanic / Latino 17% Two or more races 10% Asian 4%
- Hispanic origin (detail)
- Mexican 14%
- Common ancestry
- Italian 2% Slovak 1% Lithuanian 1%
- Foreign-born
- 12% · Canada, Vietnam, China
- Languages at home
- 82% English-only · Spanish 10% Other Indo-European 2% Vietnamese 2%
Political lean MEDSL · Tarrant
- 2024 margin
- Lean R (+5.1) · D 46.7% · R 51.9% · Other 1.4%
- 2008→2024 swing
- +6.6pp toward D · 2008: -11.7pp · 2024: -5.1pp
- All cycles
- 2024: R+5.1 2020: D+0.2 2016: R+8.7 2012: R+15.7 2008: R+11.7
Not yet ingested
- Civics
- —
Market trends
- HPI YoY
- ▼ -108.63%
- Current HPI
- 259.1952
- Rent YoY
- ▼ -1.18%
- Metro
- Dallas-Fort Worth-Arlington, TX
- State GDP YoY
- ▲ 3.95%
- F500 in state
- 110
Industry mix (Fortune 500 HQ in TX)
| Industry | F500 HQs | Revenue |
|---|---|---|
| Energy | 16 | $1,198B |
|
||
| Technology | 5 | $198B |
|
||
| Engineering / Construction | 4 | $72B |
|
||
| Energy Services | 3 | $60B |
|
||
| Utilities | 3 | $41B |
|
||
| Healthcare | 2 | $330B |
|
||
Price history
5 events — show timeline
- 2026-06-08 Sold (MLS) — NTREIS
- 2026-05-18 Pending — NTREIS
- 2026-05-01 Listed $184,900 NTREIS
- 2014-06-17 Sold (Public Records) — Public Records
- 1994-01-05 Sold (Public Records) — Public Records
Property tax history
+3.9%/yrLatest (2025): $4,252 · -18.9% YoY. Source: county tax records.
Cash-flow waterfall
monthlySold comps — $/sqft
last 12 mo · ≤1 miLoading sold comps…