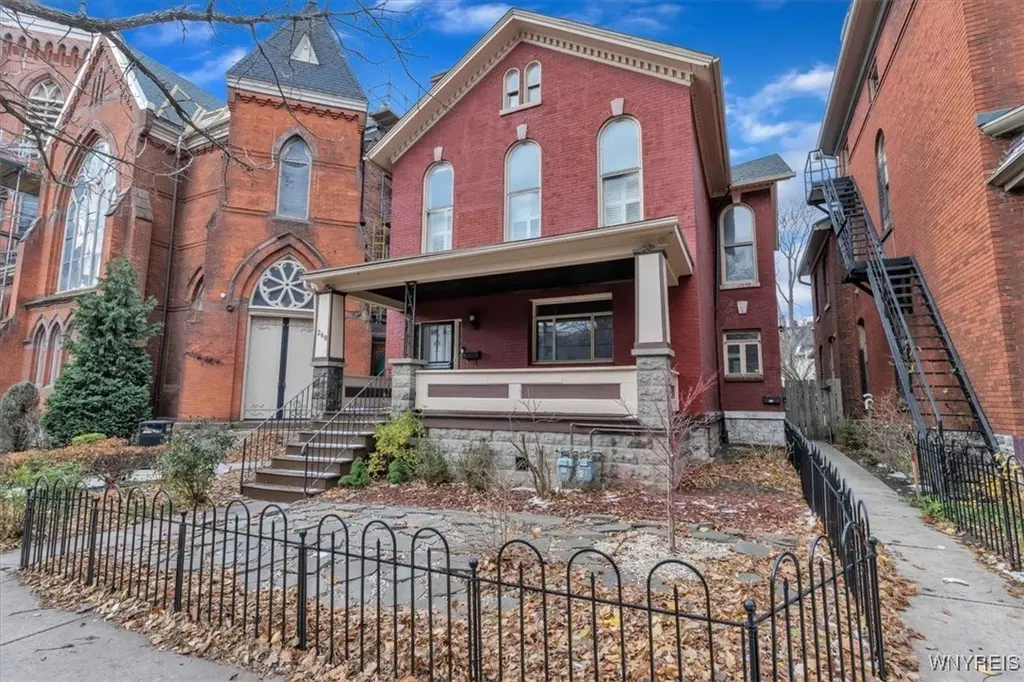
268 Georgia St
Buffalo, NY 14201
$499,900B
5 bd · 4.5 ba ·
3,352 sqft ·
Built 1900
· MultiFamily
· Active
· 181 DOM
Cashflow @ list (25.0% down · 7.5%)
Estimated rent
$5,869/mo
Mortgage (P&I)
−$2,622
Tax + insurance
−$354
HOA
−$0
Vac / Maint / Mgmt
−$1,232
Net cashflow
$1,661/mo
Annual
$19,926/yr
Cap rate
10.28%
Cash-on-cash
14.24%
DSCR
1.63
1% rule
1.17%
Cash to close
$139,972
Investor read
- This is a 3 × 3.0-bed/2.5-bath units multifamily listed at $500k.
- At list price, monthly cash flow is $2k ($20k/yr) — positive. Per door: $554/mo.
- The deal already cash-flows at list — no discount required.
- Meets the 1% rule at list price ($6k rent vs $500k).
- It's been on market 181 days — a 12% lower offer ($440k) is reasonable based on typical stale-listing flexibility.
- Recommended offer: $440k (12.0% below list) — sets the bar for market timing.
- Local home prices are declining (-3.0%/yr); year-one equity from $3k of loan paydown is wiped out by about $15k of value loss. Plan a longer hold.
- Location reads 77/100 on livability (#195 in NY, #3,011 nationally) — a middle-class / working-renter tenant base. Strengths: commute A+, housing A+, health & safety A+; Watch: crime F, employment D-.
- Buffalo City School District (urban): math 41% / reading 40% proficiency, ranked #535 of 590 in NY (top 91%) — families likely to look elsewhere, expect single-tenant / working-renter base with shorter leases; 75% free/reduced lunch — lower-income household profile, screen leases tightly.
- Watch-outs: built in 1900 — expect roof / HVAC / electrical / plumbing capex.
- Market conditions: Rents rising fast (+4.3%/yr); 56 active listings in the ZIP; lower-income renter base — watch delinquency; 1,244 units permitted in Erie County in 2024 (563 in 5+ unit buildings).
- 7 sale attempts since 13y ago; this cycle's ask has dropped $70k (12%) from the opening price — seller is motivated, your offer sets the floor, not the list.
- At projected returns (-3.0% appreciation + 4.3% rent growth), your $140k cash investment doubles in ~8 years — after that, you're playing with house money.
- Cap rate 10.3% vs local median 8.0% in Buffalo — meaningfully above typical; check what's discounted (condition, days-on-market, listing class) to confirm the premium yield is real.
- At $5,869/mo this rent would consume 174% of the median local household income ($41k/yr) (locally 1213% of renters already pay >50% of income on rent) — very limited rent-growth headroom before tenants either downsize or default.
Questions for listing agent
- It's been on market 181 days. Have you received any prior offers? Is the seller open to a 12% concession, seller financing, or rate buy-down credit?
- Can we see the unit-by-unit rent roll, current vacancy, and any below-market leases? What's the average tenancy length?
- What capital expenditures (roof, boiler, parking lot, exteriors) have been made in the last 5 years, and what's planned in the next 2?
- Built in 1900 — when were the roof, HVAC, electrical panel, plumbing, and water heater last replaced?
- Why hasn't it sold? Are there any deal-killer items the seller is aware of (foundation, flood, title, zoning, code violations)?
- Is there a deadline driving the sale (1031 exchange, divorce, estate, relocation)? That informs how much negotiation room exists.
- Crime grade is F in this area — have there been break-ins, vandalism, or insurance claims at this property in the last 3 years? What carrier currently insures it and at what premium?
- What's the average days-on-market for RENTAL listings here right now (not sales)? A rising rental-DOM trend means longer vacancies and softer asking-rent achievability than the comps imply.
CashFlowRE · CFR-CDR2ER3JJ1KPR1
· Data 2 weeks ago
cashflowre.app · 2026-05-29