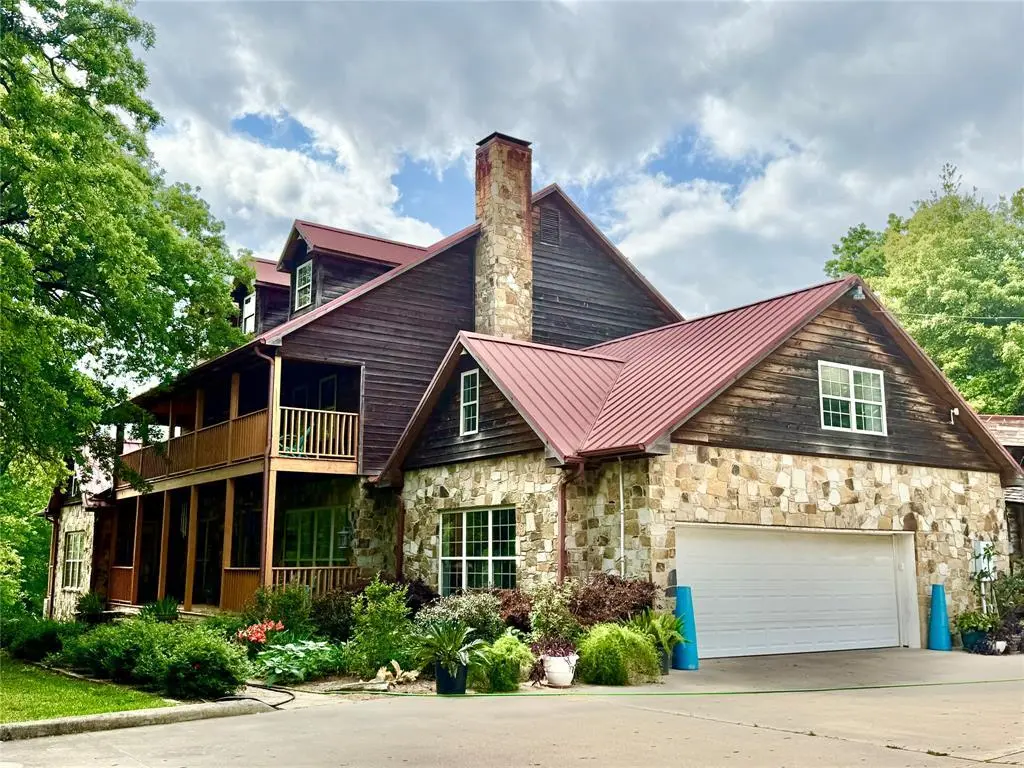
1036 Pvt Rd #8905
Canton, TX 75103
$100,000F
5 bd · 4.5 ba ·
3,833 sqft ·
Built 2004
· SingleFamily
· Active
· 14 DOM
Cashflow @ list (25.0% down · 7.5%)
Estimated rent
$1,675/mo
Mortgage (P&I)
−$4,533
Tax + insurance
−$1,441
HOA
−$0
Vac / Maint / Mgmt
−$352
Net cashflow
$-4,651/mo
Annual
$-55,809/yr
Cap rate
-0.16%
Cash-on-cash
-23.06%
DSCR
-0.03
1% rule
0.19%
Cash to close
$242,033
Investor read
- This is a 5-bed/4.5-bath single-family listed at $100k.
- At list price, monthly cash flow is $-5k ($-56k/yr) — negative.
- The deal already cash-flows at list — no discount required.
- Meets the 1% rule at list price ($2k rent vs $100k).
- Only 14 days on market — expect competitive offers; lowballing is unlikely to land.
- Local home prices are declining (-3.0%/yr); year-one equity from $6k of loan paydown is wiped out by about $26k of value loss. Plan a longer hold.
- Location reads 72/100 on livability (#239 in TX) — a middle-class / working-renter tenant base. Strengths: cost of living A+, housing A+, health & safety A+; Watch: employment C-, amenities F, commute F.
- Martins Mill ISD (rural): math 60% / reading 54% proficiency, ranked #93 of 826 in TX (top 11%) — acceptable for families but not a draw, mixed tenant base, ~2y average lease.
- Zoned schools: Martins Mill El (math 52% / reading 47%, grade D, #865 of 4,322 statewide, top 21%, 284 students, 54% FRL) — zoned schools at 54% FRL track the district average.
- Watch-outs: property tax is 13.0% of price.
- Market conditions: 259 active listings in the ZIP; 54 units permitted in Van Zandt County in 2024 (0 in 5+ unit buildings).
- Van Zandt County population projected at +4% by 2050 — modest demand growth; plan on rents tracking national, not racing it.
- 5 sale attempts since 5y ago with the ask held roughly flat each time — persistent listings suggest the price (not the market) is what's stuck; bring a comps-based counter.
- Climate carrying-cost: major wind risk, 67% chance of damaging wind over 30y; extreme-heat days projected 7→25/yr by 2055 (HVAC capex compounding) — expect insurance premiums to compound above CPI over the hold.
- Cap rate -0.2% vs local median 3.0% in Canton — below-typical yield; the buyer is paying a premium for something (appreciation thesis, condition, location) that the cap rate doesn't capture.
Questions for listing agent
- What do current leases actually rent for vs. the listed asking? Can we see a recent rent roll and the last 12 months of T-12 income?
- Property tax is high relative to price — has the assessment been appealed recently, and will the sale trigger a re-assessment?
- Is there a deadline driving the sale (1031 exchange, divorce, estate, relocation)? That informs how much negotiation room exists.
- Schools are D-rated, which usually means shorter tenancies and higher turnover. Who's the typical renter profile here, and what's been the actual vacancy rate?
- The area grade is low — what's the realistic commute time and amenity access for the typical tenant pool here? Any planned neighborhood developments (good or bad) we should know about?
- What's the average days-on-market for RENTAL listings here right now (not sales)? A rising rental-DOM trend means longer vacancies and softer asking-rent achievability than the comps imply.
- What's the recent tenant-quality profile in this submarket — average credit score on applications, eviction rate, late-payment / NSF rate, and stable-employment percentage? A property-management company in the area should have these aggregated.
- How much new for-sale + rental construction is in the pipeline within 1–3 miles? Heavy new supply typically softens prices + rents 12–24 months out; constrained supply supports both.
CashFlowRE · CFR-CF0B62B8GPF06E
· Data 2 days ago
cashflowre.app · 2026-05-29