 🔨 Auction
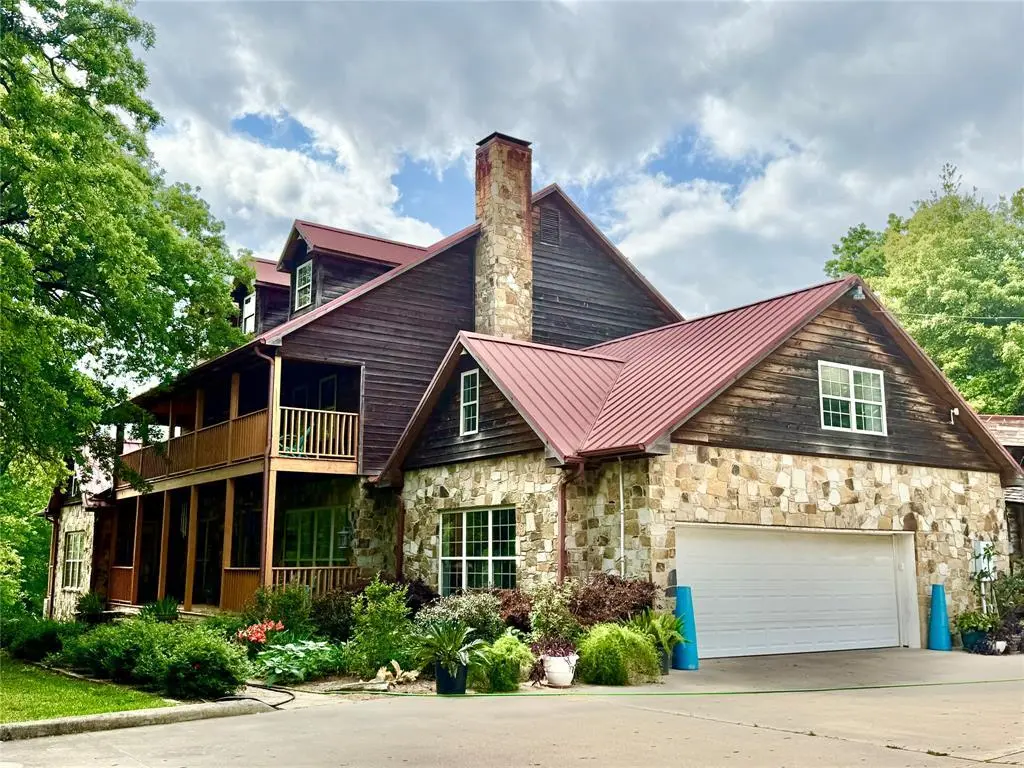
1036 Pvt Rd #8905 · Canton, TX
Flood risk 1/10 · Minimal
- FEMA flood zone
- X (unshaded)
- Chance of flooding over 30 yrs
- 0.0%
- Est. flood insurance / yr
- $507 – $1,088
Fire risk 4/10 · Minor
- Est. fire insurance / yr
- $1,222 – $2,270
Heat risk 7/10 · Major
- Hot days now (above 109°F)
- 7 days/yr
- Hot days in 30 yrs
- 25 days/yr
Wind risk 6/10 · Moderate
- Chance of severe wind over 30 yrs
- 67.0%
Air-quality risk 2/10 · Minimal
- Unhealthy air days now
- 0 days/yr
- Unhealthy air days in 30 yrs
- 1 days/yr
Risk factors via First Street. Map © Google.
Why this score? — see what drove the F grade
The composite is a weighted blend of 9 inputs, each scored 0–100. Each bar is that input's sub-score; the figure is the points it added to the 100-point composite (weight × sub-score).
- ARV discount +7.5/15.0
- Schools +4.8/10.0
- Livability +3.6/5.0
- Rent growth +2.5/5.0
- Condition / age +2.5/5.0
- Cash flow +0.0/30.0
- 1% rule +0.0/10.0
- DSCR +0.0/10.0
- Appreciation +0.0/10.0
$100,000
🖨 Deal sheet 📄 Offer letter ✓ Due diligence
Listing remarks MLS
1306 Pvt Rd #8905C: CANTON, TX LAND AUCTION CLOSING NOW! Online access is live and the clock is ticking! This is a massive 96-acre Canton spread, and bidding is in progress right now. If you wait, you lose. Drop everything and make your move immediately. ?? THE PROPERTY (DO NOT MISS THIS) 96 Pristine Acres: Massive Texas land holding in Canton. Two Residences: Main home AND separate guest house. Two Metal Shops: Large heavy-duty buildings ready for use. ?? BID NOW OR LOSE OUT The Auctioneer has authority to sell when the light turns green. Name Your Price: You set the value, but you must act immediately. Fair, Fast Competition: Easy online submission. Zero time to waste. Active Status: Bidding is aggressive and underway. Discover your price point and tell the Auctioneer before the hammer falls! Myers Jackson, Auctioneer under the direction of the seller may process and execute bids submitted (offers) that satisfy the sellers right to reservation, liberty of bidding, counter-bidding or other rights. Subject to online or offline Terms, Conditions of Sale, Offer, Price, Seller Confirmation, 15% Buyers Premium ~ TDLR 17057
Key facts
- 1 acre lot
- 2 garage spots
- Built 2004
Property features AI
Finance
- Other: Possession options include 30-60 days, closing/funding, specific date, upon completion, or other
- Financial info: Listing accepts cash, conventional, fixed, special funding, 1031 exchange, and other terms
- HOA & community: No association
Exterior
- Parking: Covered parking for 2 vehicles; Attached 2-car garage (garage faces side, 2-car single door); Circular driveway and additional parking; Driveway and concrete parking surfaces
- Utilities: Well water; Septic / private sewer (aerobic septic mentioned); Propane; Co-op electric; Cable available; Underground utilities
- Home design: Single-family residence; Residential property; Three or more levels; Entry and primary living on upper levels (levels information provided)
- Construction: Built in 2004
- Exterior features: Approximately 1 acre lot; Property is subdivided; Private road with property at the end of the road; All-weather road and concrete surfaces; Outside city limits
Interior
- Kitchen: Kitchen (appliances listed as other)
- Bedrooms: Five bedrooms (primary bedroom on second level; additional bedrooms on third level)
- Bathrooms: Four full bathrooms and one half bathroom (total 5 bathrooms)
- Heating & cooling: Central heating (electric); Central air conditioning (electric)
- Interior features: Eight total rooms; One living area and one dining area; One fireplace located in the living room; Ceiling fans; Other interior features
- Laundry & utility: Utilities and appliances not specifically listed (other)
Neighborhood map
What this means for you Summary
Snapshot
- This is a 5-bed/4.5-bath single-family listed at $100k.
Deal economics
- At list price, monthly cash flow is $-5k ($-56k/yr) — negative.
- The deal already cash-flows at list — no discount required.
- Meets the 1% rule at list price ($2k rent vs $100k).
- Cap rate -0.2% vs local median 3.0% in Canton — below-typical yield; the buyer is paying a premium for something (appreciation thesis, condition, location) that the cap rate doesn't capture.
Location & tenants
- Location reads 72/100 on livability (#239 in TX) — a middle-class / working-renter tenant base. Strengths: cost of living A+, housing A+, health & safety A+; Watch: employment C-, amenities F, commute F.
- Martins Mill ISD (rural): math 60% / reading 54% proficiency, ranked #93 of 826 in TX (top 11%) — acceptable for families but not a draw, mixed tenant base, ~2y average lease.
- Zoned schools: Martins Mill El (math 52% / reading 47%, grade D, #865 of 4,322 statewide, top 21%, 284 students, 54% FRL) — zoned schools at 54% FRL track the district average.
- Market conditions: 259 active listings in the ZIP; 54 units permitted in Van Zandt County in 2024 (0 in 5+ unit buildings).
Forward outlook
- Local home prices are declining (-3.0%/yr); year-one equity from $6k of loan paydown is wiped out by about $26k of value loss. Plan a longer hold.
- Van Zandt County population projected at +4% by 2050 — modest demand growth; plan on rents tracking national, not racing it.
Negotiation context
- Only 14 days on market — expect competitive offers; lowballing is unlikely to land.
- 5 sale attempts since 5y ago with the ask held roughly flat each time — persistent listings suggest the price (not the market) is what's stuck; bring a comps-based counter.
Risks & watch-outs
- Watch-outs: property tax is 13.0% of price.
- Climate carrying-cost: major wind risk, 67% chance of damaging wind over 30y; extreme-heat days projected 7→25/yr by 2055 (HVAC capex compounding) — expect insurance premiums to compound above CPI over the hold.
Questions for the listing agent
- What do current leases actually rent for vs. the listed asking? Can we see a recent rent roll and the last 12 months of T-12 income?
- Property tax is high relative to price — has the assessment been appealed recently, and will the sale trigger a re-assessment?
- Is there a deadline driving the sale (1031 exchange, divorce, estate, relocation)? That informs how much negotiation room exists.
- Schools are D-rated, which usually means shorter tenancies and higher turnover. Who's the typical renter profile here, and what's been the actual vacancy rate?
- The area grade is low — what's the realistic commute time and amenity access for the typical tenant pool here? Any planned neighborhood developments (good or bad) we should know about?
- What's the average days-on-market for RENTAL listings here right now (not sales)? A rising rental-DOM trend means longer vacancies and softer asking-rent achievability than the comps imply.
- What's the recent tenant-quality profile in this submarket — average credit score on applications, eviction rate, late-payment / NSF rate, and stable-employment percentage? A property-management company in the area should have these aggregated.
- How much new for-sale + rental construction is in the pipeline within 1–3 miles? Heavy new supply typically softens prices + rents 12–24 months out; constrained supply supports both.
Investment metrics
- 1% rule
- 0.19% ✗
- Cap rate
- -0.16%
- Cash-on-cash
- -23.06%
- DSCR
- -0.03
- GRM
- 43.0
CMA / ARV
- ARV (median comp)
- $864,402
- List price
- $100,000
- Delta
- 218.02%
- Verdict
- OVERPRICED
- Comps
- 1 within 2.0 mi
Projected returns pro-forma
-3.0% appreciation · 3.0% rent growth · sell at horizon
- IRR
- -66.5%
- Equity multiple
- -0.80×
- Total profit
- $-436,251
- Equity at exit
- $128,885
- IRR
- —
- Equity multiple
- -2.14×
- Total profit
- $-761,190
- Equity at exit
- $74,738
Cash invested: $242,033 (down + closing). Projections, not guarantees.
Landlord ↔ Tenant lean methodology
- Overall (STATE)
- 87 Strongly Landlord-Friendly
- State Texas
- 87 Strongly Landlord-Friendly · R+5
- County
- — inherits STATE
- City
- — inherits STATE
ZIP-level market 75103
- Home prices YoY
- -14.3%
- Active inventory
- 259
- Price-to-rent
- 5.0×
Monthly cashflow live
- Estimated rent
- $1,675 medium interval (Pro) →
- Mortgage (P&I)
- −$4,533
- Tax est. 1.5%
- −$1,081 /mo · $12,966/yr
- Insurance
- −$360
- HOA
- −$0
- Vacancy / Maint / Mgmt
- −$352
- Net cashflow
- $-4,651
Break-even live
UW: 25.0% down · 7.5% · 30yr · 1.5% tax · 5.0% vac · 8.0% maint · 8.0% mgmt
Financing live
Cash to close
- Down payment
- $216,101
- Closing costs
- $25,932
- Reserves months
- —
- Total cash needed
- —
Loan-product check · same deal, 3 products live
Conventional
25% down · 7.5% · 30yr
- Down + closing
- —
- Monthly P&I
- —
- Monthly cashflow
- —
- DSCR
- —
- Eligible?
- —
Personal DTI + credit; lowest rate.
DSCR
20% down · 8.5% · 30yr
- Down + closing
- —
- Monthly P&I
- —
- Monthly cashflow
- —
- DSCR
- —
- Eligible?
- —
No personal income docs; deal must DSCR.
Hard money
10% down · 12.0% · 12mo
- Down + closing
- —
- Monthly P&I
- —
- Monthly cashflow
- —
- DSCR
- —
- Eligible?
- —
Short-term bridge; refi at stabilization.
Listing history 18 events
-
2026-06-18days on market $100,000 Active 14 DOM
-
2026-06-17days on market $100,000 Active 13 DOM
-
2026-06-16days on market $100,000 Active 12 DOM
-
2026-06-15days on market $100,000 Active 11 DOM
-
2026-06-13days on market $100,000 Active 9 DOM
-
2026-06-09days on market $100,000 Active 5 DOM
-
2026-06-08days on market $100,000 Active 4 DOM
-
2026-06-07price $100,000 Active 3 DOM
-
2026-06-04days on market $500,000 Active 3 DOM
-
2026-06-03days on market $500,000 Active 2 DOM
-
2026-06-02pricestatusdays on market $500,000 Active 1 DOM
-
2026-05-15historical
-
2026-05-14price $2,000,000
-
2026-04-16$2,749,000 Active
-
2022-01-27historical
-
2021-12-06$3,800,000 Active
-
2021-10-27historical
-
2021-10-16$4,100,000 Active
ⓘ Source: listings_history table (triggers on properties + properties_extension) + one-shot
backfill from property_details.listing_events for pre-trigger history.
Climate risk First Street
- Flood 1/10 Low FEMA zone X (unshaded) · 0% chance over 30 yrs
- Wildfire 4/10 Moderate
- Heat 7/10 Severe 7 d/yr ≥109°F today · 25 d/yr by 30 yrs out
- Wind 6/10 Major 67% chance of damaging wind over 30 yrs
- Air quality 2/10 Low 0 unhealthy d/yr today · 1 by 30 yrs out
Nearby sold comps map
Loading sold comps map…
Walkable amenities ~0.75 mi
Loading nearby amenities…
Taxation est. · year 1
- Rental income
- $20,096
- − Mortgage interest
- −$48,420
- − Property taxes
- −$12,966
- − Insurance
- −$4,322
- − Repairs & maintenance
- −$1,608
- − Management
- −$1,608
- − Depreciation
- −$25,146
- Taxable loss
- −$73,974
- Est. tax savings @ 24.0%
- +$17,754
- After-tax cash flow
- $-38,055/yr
For passive investors: Depreciation is non-cash, so a rental often shows a tax loss while cash-flowing — sheltering income. Rental losses are passive: they offset passive income freely, and up to $25,000/yr can offset ordinary (W-2) income if you actively participate and your MAGI is under $100k (phasing out to $0 by $150k); unused losses carry forward. On sale, claimed depreciation is recaptured at up to 25%, and gains may owe capital-gains tax (a 1031 exchange can defer both). Figures are a year-1 estimate at your 24.0% rate — not tax advice; consult a CPA.
Schools (NCES district)
- District
- Martins Mill ISD
- NCES district ID
- 4829220
- Math proficiency
- 60% ▬ 0.00%
- Reading proficiency
- 54% ▼ -3.00%
- Median HH income
- $47,810
- Composite
- 48.41/100
- National rank
- #2135
- State rank
- #93 of 826 in TX
Livability — Canton
- Score
- 72/100
- State rank
- #239
- US rank
- #5787
Category grades
Schools grade is shown separately in the Schools card above.
Census & demographics
- Population (ZIP)
- 16,222
Population outlook (Van Zandt County) Hauer SSP2
- Today (2025)
- 55,634 people
- By 2030
- 56,479 · +1.5%
- By 2040
- 57,672 · +3.7%
- By 2050
- 57,913 · +4.1%
- By 2075
- 57,544 · +3.4%
- By 2100
- 52,659 · -5.3%
Race, ethnicity, and origin ACS 2023
- Neighborhood character
- Predominantly White (86%)
- Race & ethnicity
- White 86% Hispanic / Latino 7% Two or more races 5% Black 1%
- Hispanic origin (detail)
- Mexican 7%
- Common ancestry
- Lithuanian 2% Italian 1% Slovak 1%
- Foreign-born
- 2% · Canada
- Languages at home
- 95% English-only · Spanish 4%
Political lean MEDSL · Van Zandt
- 2024 margin
- Solid R (+74.8) · D 12.3% · R 87.2%
- 2008→2024 swing
- -19.8pp toward R · 2008: -55.1pp · 2024: -74.8pp
- All cycles
- 2024: R+74.8 2020: R+72.1 2016: R+72.1 2012: R+66.6 2008: R+55.1
Not yet ingested
- Civics
- —
Market trends
- HPI YoY
- ▼ -38.07%
- Current HPI
- 227.6156
- Rent YoY
- —
- Metro
- —
- State GDP YoY
- ▲ 3.95%
- F500 in state
- 110
Industry mix (Fortune 500 HQ in TX)
| Industry | F500 HQs | Revenue |
|---|---|---|
| Energy | 16 | $1,198B |
|
||
| Technology | 5 | $198B |
|
||
| Engineering / Construction | 4 | $72B |
|
||
| Energy Services | 3 | $60B |
|
||
| Utilities | 3 | $41B |
|
||
| Healthcare | 2 | $330B |
|
||
Price history
-97.6% since first listed9 events — show timeline
- 2026-06-04 Listed $100,000 NTREIS
- 2026-05-31 Listed $500,000 NTREIS
- 2026-05-15 Listing Removed — NTREIS
- 2026-05-14 Price Changed $2,000,000 NTREIS
- 2026-04-16 Listed $2,749,000 NTREIS
- 2022-01-27 Listing Removed — NTREIS
- 2021-12-06 Listed $3,800,000 NTREIS
- 2021-10-27 Listing Removed — NTREIS
- 2021-10-16 Listed $4,100,000 NTREIS
Property tax history
+3.1%/yrLatest (2025): $18,149 · +39.3% YoY. Source: county tax records.
Cash-flow waterfall
monthlySold comps — $/sqft
last 12 mo · ≤1 miLoading sold comps…