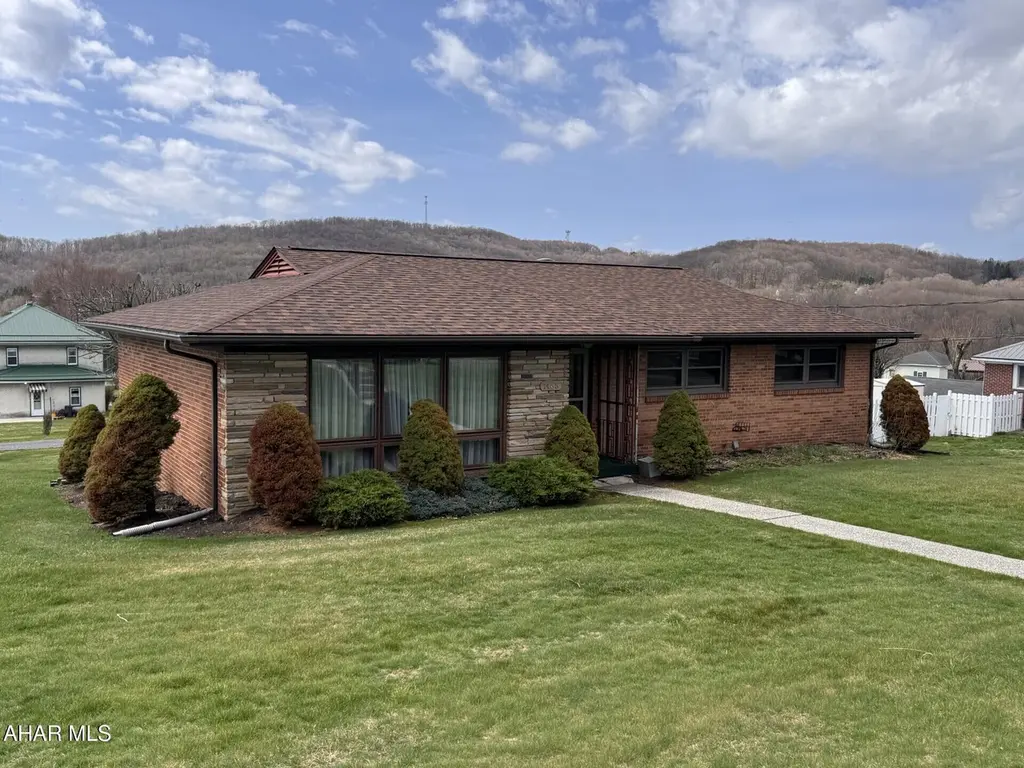
1465 3rd St
Nanty-Glo, PA 15943
$160,000D-
3 bd · 2.0 ba ·
1,668 sqft ·
Built 1958
· SingleFamily
· Pending
· 9 DOM
Cashflow @ list (25.0% down · 7.5%)
Estimated rent
$1,290/mo
Mortgage (P&I)
−$839
Tax + insurance
−$217
HOA
−$0
Vac / Maint / Mgmt
−$271
Net cashflow
$-37/mo
Annual
$-440/yr
Cap rate
6.02%
Cash-on-cash
-0.98%
DSCR
0.96
1% rule
0.81%
Cash to close
$44,800
Investor read
- This is a 3-bed/2.0-bath single-family listed at $160k.
- At list price, monthly cash flow is $-37 ($-440/yr) — negative.
- To cash-flow at today's rent, offer at most $154k (4.0% below list).
- To meet the 1% rule (rent ≥ 1% of price), the offer needs to be $129k (19.4% below list).
- Only 9 days on market — expect competitive offers; lowballing is unlikely to land.
- Recommended offer: $129k (19.4% below list) — sets the bar for 1% rule.
- In year one you build about $3k of equity ($1k loan paydown + $2k appreciation (1.0% local appreciation)).
- Location reads: area grade D — affects rentability + tenant quality, not the cash-flow math above.
- Blacklick Valley SD (town): math 37% / reading 50% proficiency, ranked #310 of 539 in PA (top 58%) — families likely to look elsewhere, expect single-tenant / working-renter base with shorter leases.
- Zoned schools: Blacklick Valley El Ctr (math 42% / reading 52%, grade D-, #737 of 1,518 statewide, top 52%, 318 students, 100% FRL); Blacklick Valley Jshs (math 32% / reading 47%, grade F, #265 of 437 statewide, top 63%, 282 students, 73% FRL) — zoned schools average 87% FRL vs 43% district-wide (44 pts higher); higher-poverty schools than district average — tighter screening recommended.
- Watch-outs: built in 1958 — expect roof / HVAC / electrical / plumbing capex.
- Market conditions: 11 active listings in the ZIP; 64 units permitted in Cambria County in 2024 (0 in 5+ unit buildings).
- Cambria County population projected at -28% by 2050 — secular population decline; favor cash flow + early exit over multi-decade hold.
- 2 sale attempts with the ask held roughly flat each time — persistent listings suggest the price (not the market) is what's stuck; bring a comps-based counter.
Questions for listing agent
- What do current leases actually rent for vs. the listed asking? Can we see a recent rent roll and the last 12 months of T-12 income?
- Built in 1958 — when were the roof, HVAC, electrical panel, plumbing, and water heater last replaced?
- Is there a deadline driving the sale (1031 exchange, divorce, estate, relocation)? That informs how much negotiation room exists.
- The area grade is low — what's the realistic commute time and amenity access for the typical tenant pool here? Any planned neighborhood developments (good or bad) we should know about?
- What's the average days-on-market for RENTAL listings here right now (not sales)? A rising rental-DOM trend means longer vacancies and softer asking-rent achievability than the comps imply.
- What's the recent tenant-quality profile in this submarket — average credit score on applications, eviction rate, late-payment / NSF rate, and stable-employment percentage? A property-management company in the area should have these aggregated.
- How much new for-sale + rental construction is in the pipeline within 1–3 miles? Heavy new supply typically softens prices + rents 12–24 months out; constrained supply supports both.
CashFlowRE · CFR-CFA70KEEGA06YW
· Data 4 weeks ago
cashflowre.app · 2026-05-29