1465 3rd St · Nanty-Glo, PA
Flood risk 1/10 · Minimal
- FEMA flood zone
- X (unshaded)
- Chance of flooding over 30 yrs
- 0.0%
- Est. flood insurance / yr
- $507 – $1,088
Fire risk 1/10 · Minimal
- Est. fire insurance / yr
- $511 – $949
Heat risk 3/10 · Minor
- Hot days now (above 91°F)
- 8 days/yr
- Hot days in 30 yrs
- 19 days/yr
Wind risk 2/10 · Minimal
- Chance of severe wind over 30 yrs
- —
Air-quality risk 3/10 · Minor
- Unhealthy air days now
- 2 days/yr
- Unhealthy air days in 30 yrs
- 5 days/yr
Risk factors via First Street. Map © Google.
Why this score? — see what drove the D- grade
The composite is a weighted blend of 9 inputs, each scored 0–100. Each bar is that input's sub-score; the figure is the points it added to the 100-point composite (weight × sub-score).
- Cash flow +12.0/30.0
- Appreciation +5.5/10.0
- DSCR +3.6/10.0
- Schools +3.6/10.0
- 1% rule +3.1/10.0
- Rent growth +2.5/5.0
- Livability +2.5/5.0
- Condition / age +2.5/5.0
- ARV discount +0.0/15.0
$160,000
🖨 Deal sheet (PDF) 📄 Offer letter ✓ Due diligence
Listing remarks MLS
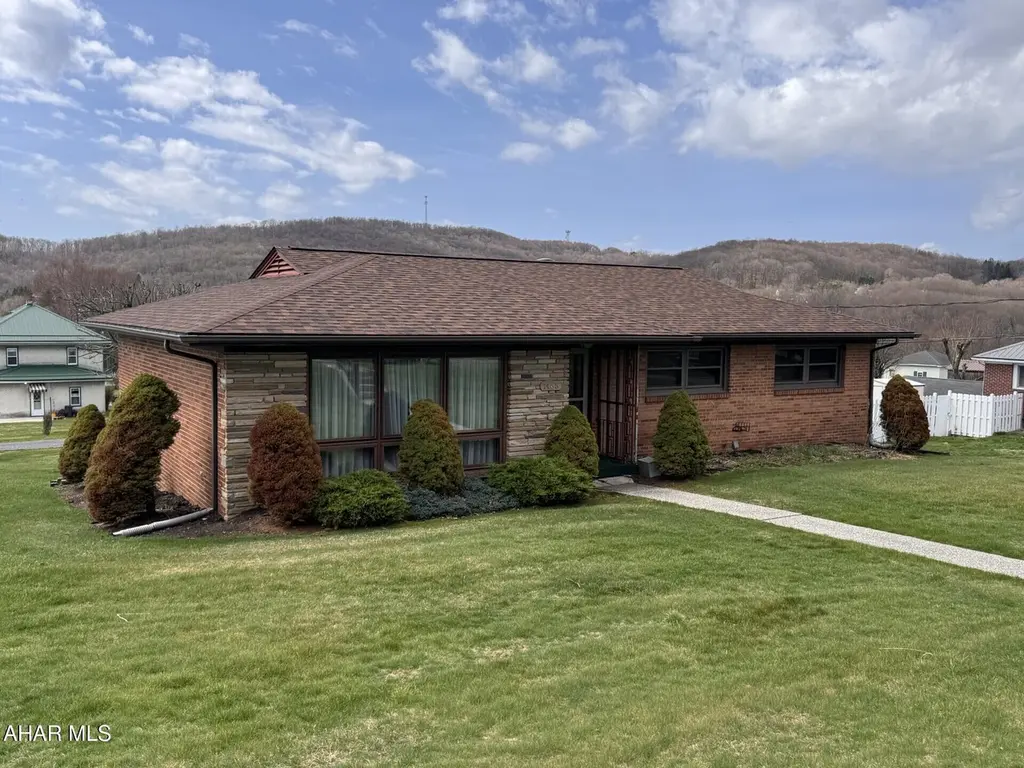
3 bedroom 2 bath brick & stone ranch home on 1/4 acre+ corner lot. Sunken LR, DR, Spacious eat-in kitchen. Large rear deck with a great view & outdoor area under the deck. Finished family room in the basement. 1 Car integral garage. New 200 amp electrical service.
Key facts
- Finished family room
- Corner lot
- Large rear deck
Tags
Neighborhood map
What this means for you Summary
Snapshot
- This is a 3-bed/2.0-bath single-family listed at $160k.
Deal economics
- At list price, monthly cash flow is $-37 ($-440/yr) — negative.
- To cash-flow at today's rent, offer at most $154k (4.0% below list).
- To meet the 1% rule (rent ≥ 1% of price), the offer needs to be $129k (19.4% below list).
- Recommended offer: $129k (19.4% below list) — sets the bar for 1% rule.
Location & tenants
- Location reads: area grade D — affects rentability + tenant quality, not the cash-flow math above.
- Blacklick Valley SD (town): math 37% / reading 50% proficiency, ranked #310 of 539 in PA (top 58%) — families likely to look elsewhere, expect single-tenant / working-renter base with shorter leases.
- Zoned schools: Blacklick Valley El Ctr (math 42% / reading 52%, grade D-, #737 of 1,518 statewide, top 52%, 318 students, 100% FRL); Blacklick Valley Jshs (math 32% / reading 47%, grade F, #265 of 437 statewide, top 63%, 282 students, 73% FRL) — zoned schools average 87% FRL vs 43% district-wide (44 pts higher); higher-poverty schools than district average — tighter screening recommended.
- Market conditions: 11 active listings in the ZIP; 64 units permitted in Cambria County in 2024 (0 in 5+ unit buildings).
Forward outlook
- In year one you build about $3k of equity ($1k loan paydown + $2k appreciation (1.0% local appreciation)).
- Cambria County population projected at -28% by 2050 — secular population decline; favor cash flow + early exit over multi-decade hold.
Negotiation context
- Only 9 days on market — expect competitive offers; lowballing is unlikely to land.
- 2 sale attempts with the ask held roughly flat each time — persistent listings suggest the price (not the market) is what's stuck; bring a comps-based counter.
Risks & watch-outs
- Watch-outs: built in 1958 — expect roof / HVAC / electrical / plumbing capex.
Questions for the listing agent
- What do current leases actually rent for vs. the listed asking? Can we see a recent rent roll and the last 12 months of T-12 income?
- Built in 1958 — when were the roof, HVAC, electrical panel, plumbing, and water heater last replaced?
- Is there a deadline driving the sale (1031 exchange, divorce, estate, relocation)? That informs how much negotiation room exists.
- The area grade is low — what's the realistic commute time and amenity access for the typical tenant pool here? Any planned neighborhood developments (good or bad) we should know about?
- What's the average days-on-market for RENTAL listings here right now (not sales)? A rising rental-DOM trend means longer vacancies and softer asking-rent achievability than the comps imply.
- What's the recent tenant-quality profile in this submarket — average credit score on applications, eviction rate, late-payment / NSF rate, and stable-employment percentage? A property-management company in the area should have these aggregated.
- How much new for-sale + rental construction is in the pipeline within 1–3 miles? Heavy new supply typically softens prices + rents 12–24 months out; constrained supply supports both.
Investment metrics
- 1% rule
- 0.81% ✗
- Cap rate
- 6.02%
- Cash-on-cash
- -0.98%
- DSCR
- 0.96
- GRM
- 10.3
CMA / ARV
- ARV (on-the-fly)
- $128,436
- Comps found
- 9
Show comp detail 9 sales within ~0.75 mi
| Address | Dist | Beds/Ba | Sqft | Sold | Price | $/sf | Match |
|---|---|---|---|---|---|---|---|
| 1297 3rd St | 0.11mi | 3/1.0 | 1,465 (-12%) | 7mo | $127,500 | $87 | 65 |
| 1071 2nd St | 0.29mi | 4/2.0 (+1) | 1,786 (+7%) | 7mo | $140,000 | $78 | 64 |
| 1020 Cardiff Rd | 0.42mi | 4/1.5 (+1) | 1,764 (+6%) | 5mo | $40,000 | $23 | 60 |
| 1452 Roberts St | 0.42mi | 3/1.5 | 1,800 (+8%) | 9mo | $143,000 | $79 | 58 |
| 1396 2nd St | 0.11mi | 4/1.0 (+1) | 1,456 (-13%) | 9mo | $75,000 | $52 | 57 |
| 1375 Davis St | 0.50mi | 4/2.0 (+1) | 1,550 (-7%) | 8mo | $120,000 | $77 | 53 |
| 1199 Rodgers St | 0.30mi | 4/1.5 (+1) | 1,836 (+10%) | 21mo | $149,900 | $82 | 45 |
| 651 Mccoy St | 0.66mi | 4/2.0 (+1) | 1,890 (+13%) | 12mo | $70,000 | $37 | 32 |
| 637 Mccoy St | 0.69mi | 3/1.5 | 1,480 (-11%) | 20mo | $89,900 | $61 | 31 |
Match score weights: distance 35% · size 25% · config 20% · recency 20%. Top-matched comps best support the ARV.
Projected returns pro-forma
1.0% appreciation · 3.0% rent growth · sell at horizon
- IRR
- 0.3%
- Equity multiple
- 1.01×
- Total profit
- $663
- Equity at exit
- $54,638
- IRR
- 5.1%
- Equity multiple
- 1.62×
- Total profit
- $27,592
- Equity at exit
- $72,622
Cash invested: $44,800 (down + closing). Projections, not guarantees.
Landlord ↔ Tenant lean methodology
- Overall (STATE)
- 62 Landlord-Friendly
- State Pennsylvania
- 62 Landlord-Friendly · EVEN
- County
- — inherits STATE
- City
- — inherits STATE
ZIP-level market 15943
- Home prices YoY
- 1.0%
- Active inventory
- 11
- Price-to-rent
- 10.3×
Monthly cashflow live
- Estimated rent
- $1,290 medium interval (Pro) →
- Mortgage (P&I)
- −$839
- Tax from tax record
- −$150 /mo · $1,803/yr
- Insurance
- −$67
- HOA
- −$0
- Vacancy / Maint / Mgmt
- −$271
- Net cashflow
- $-37
Break-even live
Sensitivity live
| Price | -10% $54 | -5% $9 | +0% $-37 | +5% $-82 | +10% $-127 |
|---|---|---|---|---|---|
| Rent | -10% $-139 | -5% $-88 | +0% $-37 | +5% $14 | +10% $65 |
| Rate | -1.0pp $44 | -0.5pp $4 | base $-37 | +0.5pp $-78 | +1.0pp $-120 |
UW: 25.0% down · 7.5% · 30yr · 1.5% tax · 5.0% vac · 8.0% maint · 8.0% mgmt
Financing live
Cash to close
- Down payment
- $40,000
- Closing costs
- $4,800
- Reserves months
- —
- Total cash needed
- —
Loan-product check · same deal, 3 products live
Conventional
25% down · 7.5% · 30yr
- Down + closing
- —
- Monthly P&I
- —
- Monthly cashflow
- —
- DSCR
- —
- Eligible?
- —
Personal DTI + credit; lowest rate.
DSCR
20% down · 8.5% · 30yr
- Down + closing
- —
- Monthly P&I
- —
- Monthly cashflow
- —
- DSCR
- —
- Eligible?
- —
No personal income docs; deal must DSCR.
Hard money
10% down · 12.0% · 12mo
- Down + closing
- —
- Monthly P&I
- —
- Monthly cashflow
- —
- DSCR
- —
- Eligible?
- —
Short-term bridge; refi at stabilization.
Listing history 5 events
-
2026-05-15soldstatus $170,000 Closed 276-char remark
Show marketing remark (276 chars)
3 bedroom 2 bath brick & stone ranch home on 1/4 acre+ corner lot. Sunken LR, DR, Spacious eat-in kitchen. Large rear deck with a great view & outdoor area under the deck. Finished family room in the basement. 1 Car integral garage. New 200 amp electrical service.
-
2026-04-11status Pending
Show marketing remark (276 chars)
3 bedroom 2 bath brick & stone ranch home on 1/4 acre+ corner lot. Sunken LR, DR, Spacious eat-in kitchen. Large rear deck with a great view & outdoor area under the deck. Finished family room in the basement. 1 Car integral garage. New 200 amp electrical service.
-
2026-04-11status Pending 276-char remark
Show marketing remark (276 chars)
3 bedroom 2 bath brick & stone ranch home on 1/4 acre+ corner lot. Sunken LR, DR, Spacious eat-in kitchen. Large rear deck with a great view & outdoor area under the deck. Finished family room in the basement. 1 Car integral garage. New 200 amp electrical service.
-
2026-04-01$160,000 Active 276-char remark
Show marketing remark (276 chars)
3 bedroom 2 bath brick & stone ranch home on 1/4 acre+ corner lot. Sunken LR, DR, Spacious eat-in kitchen. Large rear deck with a great view & outdoor area under the deck. Finished family room in the basement. 1 Car integral garage. New 200 amp electrical service.
-
2026-04-01$160,000 Active
Show marketing remark (276 chars)
3 bedroom 2 bath brick & stone ranch home on 1/4 acre+ corner lot. Sunken LR, DR, Spacious eat-in kitchen. Large rear deck with a great view & outdoor area under the deck. Finished family room in the basement. 1 Car integral garage. New 200 amp electrical service.
ⓘ Source: listings_history table (triggers on properties + properties_extension) + one-shot
backfill from property_details.listing_events for pre-trigger history.
Tax reassessment forecast PA · Partial reset (capped growth)
- Current annual tax
- $1,803 · $150/mo
- Projected year-2 tax
- $2,165 · $180/mo
- Expected delta
- +$363/yr (+$30/mo · 20.1%)
ⓘ Screening estimate from a state-policy table — verify with the county assessor before closing.
Climate risk First Street
- Flood 1/10 Low FEMA zone X (unshaded) · 0% chance over 30 yrs
- Wildfire 1/10 Low
- Heat 3/10 Moderate 8 d/yr ≥91°F today · 19 d/yr by 30 yrs out
- Wind 2/10 Low
- Air quality 3/10 Moderate 2 unhealthy d/yr today · 5 by 30 yrs out
Nearby sold comps map
Loading sold comps map…
Walkable amenities ~0.75 mi
Loading nearby amenities…
Taxation est. · year 1
- Rental income
- $15,483
- − Mortgage interest
- −$8,962
- − Property taxes
- −$1,803
- − Insurance
- −$800
- − Repairs & maintenance
- −$1,239
- − Management
- −$1,239
- − Depreciation
- −$4,655
- Taxable loss
- −$3,214
- Est. tax savings @ 24.0%
- +$771
- After-tax cash flow
- $332/yr
For passive investors: Depreciation is non-cash, so a rental often shows a tax loss while cash-flowing — sheltering income. Rental losses are passive: they offset passive income freely, and up to $25,000/yr can offset ordinary (W-2) income if you actively participate and your MAGI is under $100k (phasing out to $0 by $150k); unused losses carry forward. On sale, claimed depreciation is recaptured at up to 25%, and gains may owe capital-gains tax (a 1031 exchange can defer both). Figures are a year-1 estimate at your 24.0% rate — not tax advice; consult a CPA.
Schools (NCES district)
- District
- Blacklick Valley SD
- NCES district ID
- 4203690
- Math proficiency
- 37% ▲ 7.00%
- Reading proficiency
- 50% ▲ 5.00%
- Median HH income
- $38,550
- Composite
- 36.25/100
- National rank
- #4712
- State rank
- #310 of 539 in PA
Livability — Nanty-Glo
No livability data for this city. (Only ~50 U.S. cities are tracked.)
Census & demographics
- Census place
- Nanty-Glo, PA
- City population
- 3,747
- Population (ZIP)
- 3,747
Population outlook (Cambria County) Hauer SSP2
- Today (2025)
- 122,754 people
- By 2030
- 115,827 · -5.6%
- By 2040
- 101,309 · -17.5%
- By 2050
- 88,379 · -28.0%
- By 2075
- 65,237 · -46.9%
- By 2100
- 46,909 · -61.8%
Race, ethnicity, and origin ACS 2023
- Neighborhood character
- Predominantly White (96%)
- Race & ethnicity
- White 96% Two or more races 2%
- Common ancestry
- Romanian 7% Lithuanian 2% Italian 2%
- Foreign-born
- 1%
- Languages at home
- 99% English-only · German/W. Germanic 1%
Political lean MEDSL · Cambria
- 2024 margin
- Solid R (+39.7) · D 29.8% · R 69.5%
- 2008→2024 swing
- -40.4pp toward R · 2008: 0.7pp · 2024: -39.7pp
- All cycles
- 2024: R+39.7 2020: R+37.3 2016: R+37.8 2012: R+17.8 2008: D+0.7
Not yet ingested
- Civics
- —
Market trends
- HPI YoY
- ▲ 1.00%
- Current HPI
- 97.1064
- Rent YoY
- —
- Metro
- —
- State GDP YoY
- ▲ 1.68%
- F500 in state
- 34
Industry mix (Fortune 500 HQ in PA)
| Industry | F500 HQs | Revenue |
|---|---|---|
| Healthcare | 2 | $309B |
|
||
| Insurance | 2 | $27B |
|
||
| Telecommunications / Media | 1 | $124B |
|
||
| Industrial Distribution | 1 | $22B |
|
||
| Financial Services | 1 | $20B |
|
||
| Chemicals / Materials | 1 | $18B |
|
||
Price history
+6.2% since first listed5 events — show timeline
- 2026-05-15 Sold (MLS) $170,000 AHARMLS
- 2026-04-11 Pending — CSMLS
- 2026-04-11 Pending — AHARMLS
- 2026-04-01 Listed $160,000 CSMLS
- 2026-04-01 Listed $160,000 AHARMLS
Property tax history
+1.3%/yrLatest (2026): $1,803 · +0.0% YoY. Source: county tax records.
Cash-flow waterfall
monthlySold comps — $/sqft
last 12 mo · ≤1 miLoading sold comps…