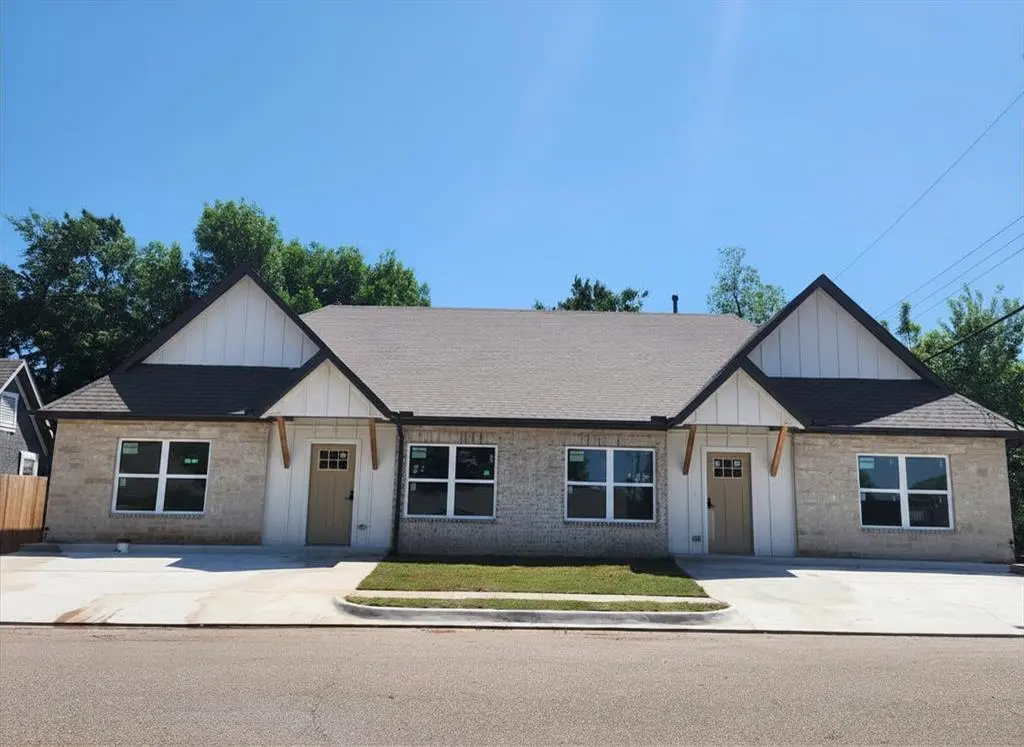
100 S Walnut St
Edmond, OK 73003
$469,900D
8 bd · 6.0 ba ·
2,600 sqft ·
Built 2026
· MultiFamily
· Active
· 31 DOM
Cashflow @ list (25.0% down · 7.5%)
Estimated rent
$3,963/mo
Mortgage (P&I)
−$2,464
Tax + insurance
−$783
HOA
−$0
Vac / Maint / Mgmt
−$832
Net cashflow
$-117/mo
Annual
$-1,399/yr
Cap rate
6.00%
Cash-on-cash
-1.06%
DSCR
0.95
1% rule
0.84%
Cash to close
$131,572
Investor read
- This is a 2 × 4-bed/3.0-bath units multifamily listed at $470k. Condition is rated excellent.
- At list price, monthly cash flow is $-117 ($-1k/yr) — negative. Per door: $-58/mo.
- To cash-flow at today's rent, offer at most $453k (3.6% below list).
- To meet the 1% rule (rent ≥ 1% of price), the offer needs to be $396k (15.7% below list).
- It's been on market 31 days — a 3% lower offer ($456k) is reasonable based on typical stale-listing flexibility.
- Recommended offer: $396k (15.7% below list) — sets the bar for 1% rule.
- Local home prices are declining (-3.0%/yr); year-one equity from $3k of loan paydown is wiped out by about $14k of value loss. Plan a longer hold.
- Location reads 78/100 on livability (#6 in OK, #2,383 nationally) — a middle-class / working-renter tenant base. Strengths: employment A+, housing A+, crime A-; Watch: health & safety C-, commute F.
- Edmond (suburban): math 38% / reading 40% proficiency, ranked #11 of 270 in OK (top 4%) — families likely to look elsewhere, expect single-tenant / working-renter base with shorter leases.
- Zoned schools: Ida Freeman Es (math 17% / reading 17%, grade F, #540 of 845 statewide, top 68%, 464 students, 0% FRL); Central Ms (math 40% / reading 42%, grade F, #5 of 345 statewide, top 1%, 980 students, 0% FRL); North Hs (math 47% / reading 57%, grade D+, #1 of 447 statewide, top 0%, 2,555 students, 0% FRL) — zoned schools average 0% FRL vs 22% district-wide (22 pts lower); this property's tenant base skews higher-income than the district average.
- Market conditions: Rents rising (+3.9%/yr); 220 active listings in the ZIP; solid renter incomes; 5,365 units permitted in Oklahoma County in 2024 (569 in 5+ unit buildings).
- Oklahoma County population projected at +41% by 2050 — long-run rental-demand tailwind backs the buy-and-hold thesis.
- 2 sale attempts; this cycle's ask has dropped $30k (6%) from the opening price — seller is motivated, your offer sets the floor, not the list.
- Cap rate 6.0% vs local median 3.4% in Edmond — top-decile yield for the area; either an underpriced asset or a hidden risk that comps aren't pricing in. Stress-test before assuming the spread holds.
- At $3,963/mo this rent would consume 61% of the median local household income ($78k/yr) (locally 988% of renters already pay >50% of income on rent) — very limited rent-growth headroom before tenants either downsize or default.
Questions for listing agent
- What do current leases actually rent for vs. the listed asking? Can we see a recent rent roll and the last 12 months of T-12 income?
- It's been on market 31 days. Have you received any prior offers? Is the seller open to a 16% concession, seller financing, or rate buy-down credit?
- Can we see the unit-by-unit rent roll, current vacancy, and any below-market leases? What's the average tenancy length?
- What capital expenditures (roof, boiler, parking lot, exteriors) have been made in the last 5 years, and what's planned in the next 2?
- Is there a deadline driving the sale (1031 exchange, divorce, estate, relocation)? That informs how much negotiation room exists.
- Schools are A-rated — typically a magnet for longer-tenancy family renters. What's the average tenant stay here, and is there a school-zone premium baked into asking?
- The area grade is low — what's the realistic commute time and amenity access for the typical tenant pool here? Any planned neighborhood developments (good or bad) we should know about?
- What's the average days-on-market for RENTAL listings here right now (not sales)? A rising rental-DOM trend means longer vacancies and softer asking-rent achievability than the comps imply.
CashFlowRE · CFR-CG5VC78QSMS3NF
· Data 1 day ago
cashflowre.app · 2026-05-29