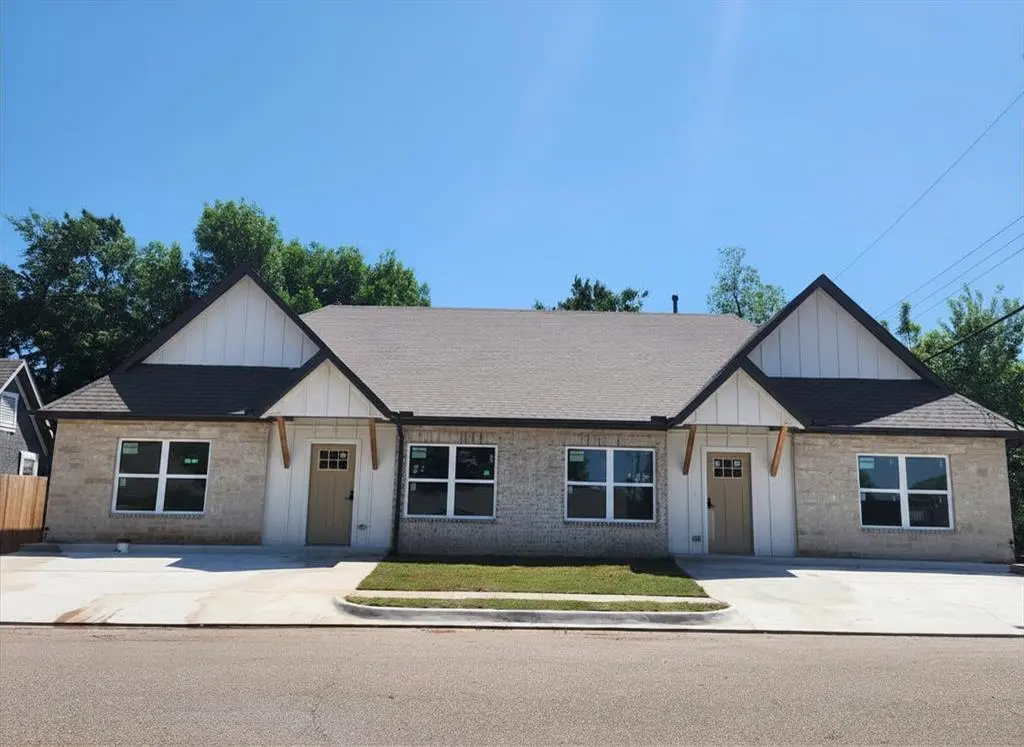
 Duplex
100 S Walnut St · Edmond, OK
Flood risk No data
- FEMA flood zone
- —
- Chance of flooding over 30 yrs
- —
- Est. flood insurance / yr
- —
Fire risk No data
- Est. fire insurance / yr
- —
Heat risk No data
- Hot days now (above threshold)
- —
- Hot days in 30 yrs
- —
Wind risk No data
- Chance of severe wind over 30 yrs
- —
Air-quality risk No data
- Unhealthy air days now
- —
- Unhealthy air days in 30 yrs
- —
Risk factors via First Street. Map © Google.
Why this score? — see what drove the D grade
The composite is a weighted blend of 9 inputs, each scored 0–100. Each bar is that input's sub-score; the figure is the points it added to the 100-point composite (weight × sub-score).
- Cash flow +11.9/30.0
- ARV discount +7.5/15.0
- Condition / age +5.0/5.0
- Livability +3.9/5.0
- Schools +3.6/10.0
- DSCR +3.5/10.0
- Rent growth +3.5/5.0
- 1% rule +3.4/10.0
- Appreciation +0.0/10.0
$469,900
🖨 Deal sheet (PDF) 📄 Offer letter ✓ Due diligence
Multi-family units
County records classify this as Multi-Family (2-4 Unit). Listing-text estimate: 2 units. confirmed
Listing remarks
Investors and want-to-be investors - this is the one you’ve been waiting for and it's ready now! Just steps from Downtown Edmond, this new construction duplex (2 doors) is built to capture strong rental demand in one of Edmond’s fastest evolving areas. Really make an imact by living in one side and renting the other side! Each unit offers 4 bedrooms, 3 bathrooms, and a two-car driveway — totaling 8 beds and 6 baths. Washer, dryer, and refrigerator are included in both units, creating a true turnkey setup for incoming tenants. Residents will be drawn to the dynamic downtown lifestyle — an eclectic mix of restaurants, breweries, coffee shops, and unique shopping ex
Key facts
- Chitwood park
- Walking distance
- Turnkey setup
Tags
Property features AI
Finance
- Other: Property listed as residential income with 2 units; Homestead eligible
- Financial info: Acceptable financing: Cash, Conventional, FHA or VA; Not assumable
- HOA & community: No mandatory association dues
Exterior
- Parking: 4 parking spaces; Concrete parking surface
- Utilities: No flood insurance required (not in flood); Geocode verified manually
- Home design: Residential income property; Duplex; Built as new home
- Construction: Brick and stone exterior; Composition roof; Slab foundation; Built by Castle Custom Homes
- Exterior features: Interior lot; Located just west of downtown Edmond, between Fretz and Kelly at Walnut and 1st
Interior
- Bedrooms: 8 bedrooms (total)
- Bathrooms: 6 full bathrooms
- Interior features: Never occupied; New construction (estimated completion May 20, 2026)
Neighborhood map
What this means for you Summary
Snapshot
- This is a 2 × 4-bed/3.0-bath units multifamily listed at $470k. Condition is rated excellent.
Deal economics
- At list price, monthly cash flow is $-117 ($-1k/yr) — negative. Per door: $-58/mo.
- To cash-flow at today's rent, offer at most $453k (3.6% below list).
- To meet the 1% rule (rent ≥ 1% of price), the offer needs to be $396k (15.7% below list).
- Recommended offer: $396k (15.7% below list) — sets the bar for 1% rule.
- Cap rate 6.0% vs local median 3.4% in Edmond — top-decile yield for the area; either an underpriced asset or a hidden risk that comps aren't pricing in. Stress-test before assuming the spread holds.
Location & tenants
- Location reads 78/100 on livability (#6 in OK, #2,383 nationally) — a middle-class / working-renter tenant base. Strengths: employment A+, housing A+, crime A-; Watch: health & safety C-, commute F.
- Edmond (suburban): math 38% / reading 40% proficiency, ranked #11 of 270 in OK (top 4%) — families likely to look elsewhere, expect single-tenant / working-renter base with shorter leases.
- Zoned schools: Ida Freeman Es (math 17% / reading 17%, grade F, #540 of 845 statewide, top 68%, 464 students, 0% FRL); Central Ms (math 40% / reading 42%, grade F, #5 of 345 statewide, top 1%, 980 students, 0% FRL); North Hs (math 47% / reading 57%, grade D+, #1 of 447 statewide, top 0%, 2,555 students, 0% FRL) — zoned schools average 0% FRL vs 22% district-wide (22 pts lower); this property's tenant base skews higher-income than the district average.
- Market conditions: Rents rising (+3.9%/yr); 220 active listings in the ZIP; solid renter incomes; 5,365 units permitted in Oklahoma County in 2024 (569 in 5+ unit buildings).
- At $3,963/mo this rent would consume 61% of the median local household income ($78k/yr) (locally 988% of renters already pay >50% of income on rent) — very limited rent-growth headroom before tenants either downsize or default.
Forward outlook
- Local home prices are declining (-3.0%/yr); year-one equity from $3k of loan paydown is wiped out by about $14k of value loss. Plan a longer hold.
- Oklahoma County population projected at +41% by 2050 — long-run rental-demand tailwind backs the buy-and-hold thesis.
Negotiation context
- It's been on market 31 days — a 3% lower offer ($456k) is reasonable based on typical stale-listing flexibility.
- 2 sale attempts; this cycle's ask has dropped $30k (6%) from the opening price — seller is motivated, your offer sets the floor, not the list.
Questions for the listing agent
- What do current leases actually rent for vs. the listed asking? Can we see a recent rent roll and the last 12 months of T-12 income?
- It's been on market 31 days. Have you received any prior offers? Is the seller open to a 16% concession, seller financing, or rate buy-down credit?
- Can we see the unit-by-unit rent roll, current vacancy, and any below-market leases? What's the average tenancy length?
- What capital expenditures (roof, boiler, parking lot, exteriors) have been made in the last 5 years, and what's planned in the next 2?
- Is there a deadline driving the sale (1031 exchange, divorce, estate, relocation)? That informs how much negotiation room exists.
- Schools are A-rated — typically a magnet for longer-tenancy family renters. What's the average tenant stay here, and is there a school-zone premium baked into asking?
- The area grade is low — what's the realistic commute time and amenity access for the typical tenant pool here? Any planned neighborhood developments (good or bad) we should know about?
- What's the average days-on-market for RENTAL listings here right now (not sales)? A rising rental-DOM trend means longer vacancies and softer asking-rent achievability than the comps imply.
- What's the recent tenant-quality profile in this submarket — average credit score on applications, eviction rate, late-payment / NSF rate, and stable-employment percentage? A property-management company in the area should have these aggregated.
- How much new apartment / multifamily construction is in the pipeline within 1–3 miles? Heavy new supply (>2% of stock underway) typically softens rents 12–24 months out; light construction supports rent growth.
Investment metrics
- 1% rule
- 0.84% ✗
- Cap rate
- 6.00%
- Cash-on-cash
- -1.06%
- DSCR
- 0.95
- GRM
- 9.9
CMA / ARV
No comps found within radius.
Projected returns pro-forma
-3.0% appreciation · 3.86% rent growth · sell at horizon
- IRR
- -17.1%
- Equity multiple
- 0.39×
- Total profit
- $-80,052
- Equity at exit
- $70,064
- IRR
- -7.5%
- Equity multiple
- 0.51×
- Total profit
- $-64,586
- Equity at exit
- $40,628
Cash invested: $131,572 (down + closing). Projections, not guarantees.
Landlord ↔ Tenant lean methodology
- Overall (STATE)
- 83 Strongly Landlord-Friendly
- State Oklahoma
- 83 Strongly Landlord-Friendly · R+20
- County
- — inherits STATE
- City
- — inherits STATE
ZIP-level market 73003
- Home prices YoY
- -31.2%
- Rents YoY
- 3.9%
- Active inventory
- 220
- Price-to-rent
- 19.8×
Monthly cashflow live
- Estimated rent
- $3,963 high interval (Pro) →
- Mortgage (P&I)
- −$2,464
- Tax est. 1.5%
- −$587 /mo · $7,048/yr
- Insurance
- −$196
- HOA
- −$0
- Vacancy / Maint / Mgmt
- −$832
- Net cashflow
- $-117
Break-even live
Sensitivity live
| Price | -10% $208 | -5% $46 | +0% $-117 | +5% $-279 | +10% $-441 |
|---|---|---|---|---|---|
| Rent | -10% $-430 | -5% $-273 | +0% $-117 | +5% $40 | +10% $196 |
| Rate | -1.0pp $120 | -0.5pp $3 | base $-117 | +0.5pp $-238 | +1.0pp $-362 |
2-unit breakdown (identical units grouped — click to expand)
| Units | Beds | Baths | Est. rent |
|---|---|---|---|
| 2× units | 4 | 3 | $3,962 |
| #1 | 4 | 3 | $1,981 |
| #2 | 4 | 3 | $1,981 |
| Total (2 units) | $3,963 | ||
UW: 25.0% down · 7.5% · 30yr · 1.5% tax · 5.0% vac · 8.0% maint · 8.0% mgmt
Financing live
Cash to close
- Down payment
- $117,475
- Closing costs
- $14,097
- Reserves months
- —
- Total cash needed
- —
Loan-product check · same deal, 3 products live
Conventional
25% down · 7.5% · 30yr
- Down + closing
- —
- Monthly P&I
- —
- Monthly cashflow
- —
- DSCR
- —
- Eligible?
- —
Personal DTI + credit; lowest rate.
DSCR
20% down · 8.5% · 30yr
- Down + closing
- —
- Monthly P&I
- —
- Monthly cashflow
- —
- DSCR
- —
- Eligible?
- —
No personal income docs; deal must DSCR.
Hard money
10% down · 12.0% · 12mo
- Down + closing
- —
- Monthly P&I
- —
- Monthly cashflow
- —
- DSCR
- —
- Eligible?
- —
Short-term bridge; refi at stabilization.
Listing history 17 events
-
2026-06-21days on market $469,900 Active 31 DOM
-
2026-06-18days on market $469,900 Active 28 DOM
-
2026-06-17days on market $469,900 Active 27 DOM
-
2026-06-16days on market $469,900 Active 26 DOM
-
2026-06-15days on market $469,900 Active 25 DOM
-
2026-06-13days on market $469,900 Active 23 DOM
-
2026-06-09days on market $469,900 Active 19 DOM
-
2026-06-08pricedays on market $469,900 Active 18 DOM
-
2026-06-07days on market $499,900 Active 17 DOM
-
2026-06-03days on market $499,900 Active 13 DOM
-
2026-06-02days on market $499,900 Active 12 DOM
-
2026-06-01days on market $499,900 Active 11 DOM
-
2026-05-31days on market $499,900 Active 10 DOM
-
2026-05-21$499,900 Active
-
2026-05-19historical
-
2026-05-08price $499,900
-
2026-03-02$479,900 Active
ⓘ Source: listings_history table (triggers on properties + properties_extension) + one-shot
backfill from property_details.listing_events for pre-trigger history.
Nearby sold comps map
Loading sold comps map…
Walkable amenities ~0.75 mi
Loading nearby amenities…
Taxation est. · year 1
- Rental income
- $47,556
- − Mortgage interest
- −$26,322
- − Property taxes
- −$7,048
- − Insurance
- −$2,350
- − Repairs & maintenance
- −$3,804
- − Management
- −$3,804
- − Depreciation
- −$13,670
- Taxable loss
- −$9,442
- Est. tax savings @ 24.0%
- +$2,266
- After-tax cash flow
- $867/yr
For passive investors: Depreciation is non-cash, so a rental often shows a tax loss while cash-flowing — sheltering income. Rental losses are passive: they offset passive income freely, and up to $25,000/yr can offset ordinary (W-2) income if you actively participate and your MAGI is under $100k (phasing out to $0 by $150k); unused losses carry forward. On sale, claimed depreciation is recaptured at up to 25%, and gains may owe capital-gains tax (a 1031 exchange can defer both). Figures are a year-1 estimate at your 24.0% rate — not tax advice; consult a CPA.
Condition & rehab AI · 13 photos
This newly constructed multi-family home is move-in ready with excellent condition and modern amenities. It offers a great opportunity for investors looking to capture strong rental demand in a rapidly evolving area.
Value-add opportunities
- Both Landscaping and curb appeal improvements — Enhanced landscaping and curb appeal can attract more tenants and buyers.
- Both Painting exterior and interior walls — Fresh paint can improve the home's curb appeal and interior aesthetics.
Renovation cost estimate screening
Value-add ROI direction
- Both Landscaping and curb appeal improvements — Enhanced landscaping and curb appeal can attract more tenants and buyers. ↑
- Both Painting exterior and interior walls — Fresh paint can improve the home's curb appeal and interior aesthetics. ↑
ⓘ Cost ranges are severity-bucket heuristics (US national rule-of-thumb). Get contractor quotes + a written scope before underwriting a rehab budget.
Schools (NCES district)
- District
- Edmond
- NCES district ID
- 4010590
- Math proficiency
- 38% ▼ -12.00%
- Reading proficiency
- 40% ▼ -12.00%
- Median HH income
- $73,212
- Composite
- 35.88/100
- National rank
- #4814
- State rank
- #11 of 270 in OK
Livability — Edmond
- Score
- 78/100
- State rank
- #6
- US rank
- #2383
Category grades
Schools grade is shown separately in the Schools card above.
Census & demographics
- Census place
- Edmond, OK
- County
- Oklahoma County · 771,644 people
- City population
- 177,083
- Metro
- Oklahoma City, OK
- Population (ZIP)
- 23,236
- Household income
- $78,149
- Rent vs Own
- Severe rent burden
- 988.0
Population outlook (Oklahoma County) Hauer SSP2
- Today (2025)
- 911,875 people
- By 2030
- 982,413 · +7.7%
- By 2040
- 1,130,468 · +24.0%
- By 2050
- 1,288,422 · +41.3%
- By 2075
- 1,711,482 · +87.7%
- By 2100
- 2,088,448 · +129.0%
Race, ethnicity, and origin ACS 2023
- Neighborhood character
- Predominantly White (69%)
- Race & ethnicity
- White 69% Two or more races 13% Black 9% Hispanic / Latino 9% Asian 3%
- Hispanic origin (detail)
- Mexican 7%
- Common ancestry
- Italian 2% Slovak 2% Lithuanian 1%
- Foreign-born
- 8% · Canada, China
- Languages at home
- 90% English-only · Spanish 5% Other Indo-European 2% Chinese 1%
Political lean MEDSL · Oklahoma
- 2024 margin
- Toss-up / Even · D 48.0% · R 49.7% · Other 2.3%
- 2008→2024 swing
- +15.1pp toward D · 2008: -16.8pp · 2024: -1.7pp
- All cycles
- 2024: R+1.7 2020: R+1.1 2016: R+10.5 2012: R+16.7 2008: R+16.8
Not yet ingested
- Civics
- —
Market trends
- HPI YoY
- ▼ -104.15%
- Current HPI
- 229.3899
- Rent YoY
- ▲ 3.86%
- Metro
- Oklahoma City, OK
- State GDP YoY
- ▲ 1.55%
- F500 in state
- 6
Industry mix (Fortune 500 HQ in OK)
| Industry | F500 HQs | Revenue |
|---|---|---|
| Energy | 3 | $48B |
|
||
Price history
+4.2% since first listed4 events — show timeline
- 2026-05-21 Listed $499,900 MLSOK
- 2026-05-19 Listing Removed — MLSOK
- 2026-05-08 Price Changed $499,900 MLSOK
- 2026-03-02 Listed $479,900 MLSOK
Cash-flow waterfall
monthlySold comps — $/sqft
last 12 mo · ≤1 miLoading sold comps…