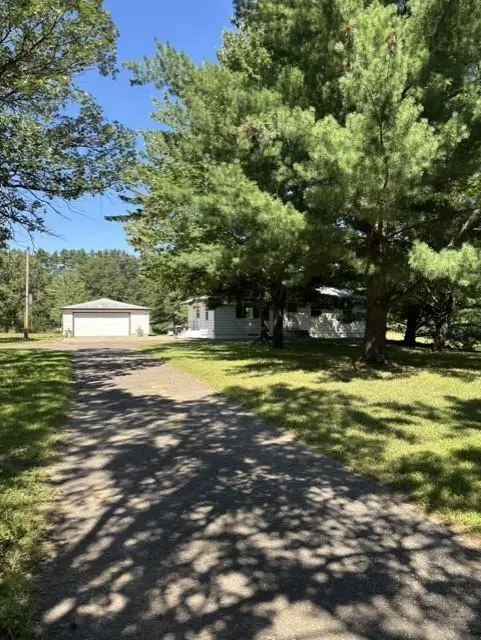
2109 161st Ave NW
Andover, MN 55304
$374,900D
3 bd · 2.0 ba ·
1,144 sqft ·
Built 1965
· SingleFamily
· Pending
· 13 DOM
Cashflow @ list (25.0% down · 7.5%)
Estimated rent
$2,889/mo
Mortgage (P&I)
−$1,966
Tax + insurance
−$360
HOA
−$0
Vac / Maint / Mgmt
−$607
Net cashflow
$-44/mo
Annual
$-525/yr
Cap rate
6.15%
Cash-on-cash
-0.50%
DSCR
0.98
1% rule
0.77%
Cash to close
$104,972
Investor read
- This is a 3-bed/2.0-bath single-family listed at $375k.
- At list price, monthly cash flow is $-44 ($-525/yr) — negative.
- To cash-flow at today's rent, offer at most $367k (2.1% below list).
- To meet the 1% rule (rent ≥ 1% of price), the offer needs to be $289k (22.9% below list).
- Only 13 days on market — expect competitive offers; lowballing is unlikely to land.
- Recommended offer: $289k (22.9% below list) — sets the bar for 1% rule.
- Local home prices are declining (-3.0%/yr); year-one equity from $3k of loan paydown is wiped out by about $11k of value loss. Plan a longer hold.
- Location reads 72/100 on livability (#291 in MN) — a middle-class / working-renter tenant base. Strengths: employment A+, housing A+, crime A; Watch: amenities F, commute F, cost of living D-.
- Anoka-Hennepin Public School District (suburban): math 49% / reading 55% proficiency, ranked #71 of 301 in MN (top 24%) — acceptable for families but not a draw, mixed tenant base, ~2y average lease.
- Zoned schools: Rum River Elementary (math 76% / reading 70%, grade A, #44 of 857 statewide, top 5%, 863 students, 23% FRL); Oak View Middle (math 57% / reading 60%, grade B, #29 of 258 statewide, top 12%, 1,268 students, 22% FRL); Andover High School (math 57% / reading 71%, grade B-, #32 of 471 statewide, top 7%, 1,758 students, 19% FRL) — zoned schools at 21% FRL track the district average.
- Zoned-school proficiency averages 65% at this address vs 52% district-wide (+13 pts) — the actual schools serving this property are materially stronger than the Anoka-Hennepin Public School District average implies; a family-tenant draw the district grade alone would hide.
- Market conditions: 402 active listings in the ZIP; 1 comparable units currently listed for rent nearby; 1,083 units permitted in Anoka County in 2024 (134 in 5+ unit buildings).
- Anoka County population projected at +11% by 2050 — modest demand growth; plan on rents tracking national, not racing it.
- Cap rate 6.2% vs local median 3.6% in Andover — top-decile yield for the area; either an underpriced asset or a hidden risk that comps aren't pricing in. Stress-test before assuming the spread holds.
Questions for listing agent
- What do current leases actually rent for vs. the listed asking? Can we see a recent rent roll and the last 12 months of T-12 income?
- Built in 1965 — when were the roof, HVAC, electrical panel, plumbing, and water heater last replaced?
- Is there a deadline driving the sale (1031 exchange, divorce, estate, relocation)? That informs how much negotiation room exists.
- Schools are A-rated — typically a magnet for longer-tenancy family renters. What's the average tenant stay here, and is there a school-zone premium baked into asking?
- The area grade is low — what's the realistic commute time and amenity access for the typical tenant pool here? Any planned neighborhood developments (good or bad) we should know about?
- What's the average days-on-market for RENTAL listings here right now (not sales)? A rising rental-DOM trend means longer vacancies and softer asking-rent achievability than the comps imply.
- What's the recent tenant-quality profile in this submarket — average credit score on applications, eviction rate, late-payment / NSF rate, and stable-employment percentage? A property-management company in the area should have these aggregated.
- How much new for-sale + rental construction is in the pipeline within 1–3 miles? Heavy new supply typically softens prices + rents 12–24 months out; constrained supply supports both.
CashFlowRE · CFR-CJ3Z4H5AYJZPZS
· Data 4 weeks ago
cashflowre.app · 2026-05-29