2109 161st Ave NW · Andover, MN
Flood risk No data
- FEMA flood zone
- —
- Chance of flooding over 30 yrs
- —
- Est. flood insurance / yr
- —
Fire risk No data
- Est. fire insurance / yr
- —
Heat risk No data
- Hot days now (above threshold)
- —
- Hot days in 30 yrs
- —
Wind risk No data
- Chance of severe wind over 30 yrs
- —
Air-quality risk No data
- Unhealthy air days now
- —
- Unhealthy air days in 30 yrs
- —
Risk factors via First Street. Map © Google.
Why this score? — see what drove the D grade
The composite is a weighted blend of 9 inputs, each scored 0–100. Each bar is that input's sub-score; the figure is the points it added to the 100-point composite (weight × sub-score).
- Cash flow +12.7/30.0
- ARV discount +9.9/15.0
- Schools +4.7/10.0
- DSCR +3.8/10.0
- Livability +3.6/5.0
- 1% rule +2.7/10.0
- Rent growth +2.5/5.0
- Condition / age +2.5/5.0
- Appreciation +0.0/10.0
$374,900
🖨 Deal sheet (PDF) 📄 Offer letter ✓ Due diligence
Listing remarks
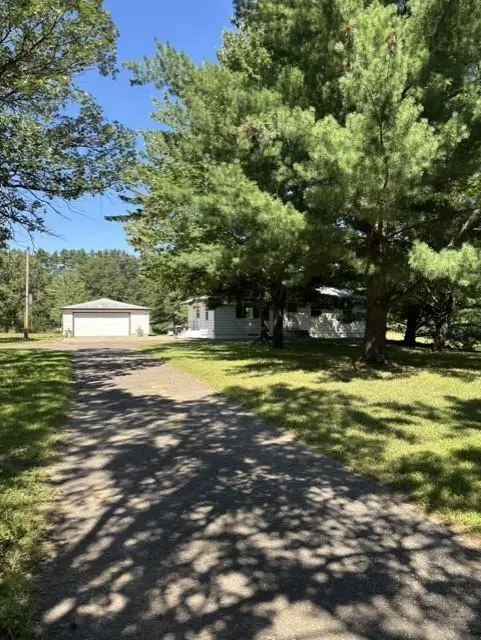
Multiple Offers Received, Highest and Best offers due by Noon Tuesday 5/19. Great opportunity to have 2.5 acres in Andover School District! This charming 4 BR 2 Bath home just needs a few updates to make it yours. The home has beautiful hardwood floors. The home has a new roof, updated windows and siding. This one-story home is a charming and well taken care of home. The garage is heated and insulated and has a mechanics pit for doing automotive work, there are also several storage sheds on this property for ample storage.
Key facts
- Mechanics pit
- Heated garage
- Updated windows
Tags
Property features AI
Finance
- Other: Publicly maintained city street access; Lot approximately 2.527 acres (lot dimensions ~299 x 368 x 299 x 368)
Exterior
- Parking: Heated, insulated garage; 2-car garage (approx. 25 x 30, 750 sq ft)
- Security: Security lights
- Utilities: Well water; Septic system (compliant); Natural gas; Electric with circuit breakers
- Home design: Residential property; One level (main living on one level); Main entry level: Main
- Construction: Frame construction; Asphalt roof (age 8 years or less); Block foundation (foundation dimensions approx. 44 x 27)
- Exterior features: Patio; Storage shed; Medium tree coverage; Security lights; No fencing
Interior
- Kitchen: Cooktop; Wall oven; Microwave; Refrigerator; Exhaust fan; Kitchen/Dining room layout
- Bedrooms: 4 bedrooms; Main-level bedroom(s); Lower-level bedroom(s)
- Flooring: Hardwood floors
- Bathrooms: One full bath on the main floor; One 3/4 bath in the basement
- Heating & cooling: Forced air heating; Central air conditioning
- Interior features: Ceiling fans; Hardwood floors; Kitchen window; Main-floor primary bedroom; Natural woodwork; Patio; Security lights; Washer/Dryer hookup; Partially finished basement; Block basement walls
- Laundry & utility: Lower-level laundry room; Washer/Dryer hookup; Gas water heater; Water softener (owned)
Neighborhood map
What this means for you Summary
Snapshot
- This is a 3-bed/2.0-bath single-family listed at $375k.
Deal economics
- At list price, monthly cash flow is $-44 ($-525/yr) — negative.
- To cash-flow at today's rent, offer at most $367k (2.1% below list).
- To meet the 1% rule (rent ≥ 1% of price), the offer needs to be $289k (22.9% below list).
- Recommended offer: $289k (22.9% below list) — sets the bar for 1% rule.
- Cap rate 6.2% vs local median 3.6% in Andover — top-decile yield for the area; either an underpriced asset or a hidden risk that comps aren't pricing in. Stress-test before assuming the spread holds.
Location & tenants
- Location reads 72/100 on livability (#291 in MN) — a middle-class / working-renter tenant base. Strengths: employment A+, housing A+, crime A; Watch: amenities F, commute F, cost of living D-.
- Anoka-Hennepin Public School District (suburban): math 49% / reading 55% proficiency, ranked #71 of 301 in MN (top 24%) — acceptable for families but not a draw, mixed tenant base, ~2y average lease.
- Zoned schools: Rum River Elementary (math 76% / reading 70%, grade A, #44 of 857 statewide, top 5%, 863 students, 23% FRL); Oak View Middle (math 57% / reading 60%, grade B, #29 of 258 statewide, top 12%, 1,268 students, 22% FRL); Andover High School (math 57% / reading 71%, grade B-, #32 of 471 statewide, top 7%, 1,758 students, 19% FRL) — zoned schools at 21% FRL track the district average.
- Zoned-school proficiency averages 65% at this address vs 52% district-wide (+13 pts) — the actual schools serving this property are materially stronger than the Anoka-Hennepin Public School District average implies; a family-tenant draw the district grade alone would hide.
- Market conditions: 395 active listings in the ZIP; 1 comparable units currently listed for rent nearby; 1,083 units permitted in Anoka County in 2024 (134 in 5+ unit buildings).
Forward outlook
- Local home prices are declining (-3.0%/yr); year-one equity from $3k of loan paydown is wiped out by about $11k of value loss. Plan a longer hold.
- Anoka County population projected at +11% by 2050 — modest demand growth; plan on rents tracking national, not racing it.
Negotiation context
- Only 13 days on market — expect competitive offers; lowballing is unlikely to land.
Questions for the listing agent
- What do current leases actually rent for vs. the listed asking? Can we see a recent rent roll and the last 12 months of T-12 income?
- Built in 1965 — when were the roof, HVAC, electrical panel, plumbing, and water heater last replaced?
- Is there a deadline driving the sale (1031 exchange, divorce, estate, relocation)? That informs how much negotiation room exists.
- Schools are A-rated — typically a magnet for longer-tenancy family renters. What's the average tenant stay here, and is there a school-zone premium baked into asking?
- The area grade is low — what's the realistic commute time and amenity access for the typical tenant pool here? Any planned neighborhood developments (good or bad) we should know about?
- What's the average days-on-market for RENTAL listings here right now (not sales)? A rising rental-DOM trend means longer vacancies and softer asking-rent achievability than the comps imply.
- What's the recent tenant-quality profile in this submarket — average credit score on applications, eviction rate, late-payment / NSF rate, and stable-employment percentage? A property-management company in the area should have these aggregated.
- How much new for-sale + rental construction is in the pipeline within 1–3 miles? Heavy new supply typically softens prices + rents 12–24 months out; constrained supply supports both.
Investment metrics
- 1% rule
- 0.77% ✗
- Cap rate
- 6.15%
- Cash-on-cash
- -0.50%
- DSCR
- 0.98
- GRM
- 10.8
CMA / ARV
- ARV (median comp)
- $395,807
- List price
- $374,900
- Delta
- -5.28%
- Verdict
- FAIR
- Comps
- 2 within 1.0 mi
Projected returns pro-forma
-3.0% appreciation · 3.0% rent growth · sell at horizon
- IRR
- -17.2%
- Equity multiple
- 0.39×
- Total profit
- $-63,653
- Equity at exit
- $55,899
- IRR
- -9.2%
- Equity multiple
- 0.43×
- Total profit
- $-59,498
- Equity at exit
- $32,415
Cash invested: $104,972 (down + closing). Projections, not guarantees.
Landlord ↔ Tenant lean methodology
- Overall (STATE)
- 46 Balanced
- State Minnesota
- 46 Balanced · D+2
- County
- — inherits STATE
- City
- — inherits STATE
ZIP-level market 55304
- Active inventory
- 395
- Price-to-rent
- 10.8×
Monthly cashflow live
- Estimated rent
- $2,889 medium interval (Pro) →
- Mortgage (P&I)
- −$1,966
- Tax from tax record
- −$204 /mo · $2,446/yr
- Insurance
- −$156
- HOA
- −$0
- Vacancy / Maint / Mgmt
- −$607
- Net cashflow
- $-44
Break-even live
Sensitivity live
| Price | -10% $169 | -5% $62 | +0% $-44 | +5% $-150 | +10% $-256 |
|---|---|---|---|---|---|
| Rent | -10% $-272 | -5% $-158 | +0% $-44 | +5% $70 | +10% $185 |
| Rate | -1.0pp $145 | -0.5pp $52 | base $-44 | +0.5pp $-141 | +1.0pp $-240 |
UW: 25.0% down · 7.5% · 30yr · 1.5% tax · 5.0% vac · 8.0% maint · 8.0% mgmt
Financing live
Cash to close
- Down payment
- $93,725
- Closing costs
- $11,247
- Reserves months
- —
- Total cash needed
- —
Loan-product check · same deal, 3 products live
Conventional
25% down · 7.5% · 30yr
- Down + closing
- —
- Monthly P&I
- —
- Monthly cashflow
- —
- DSCR
- —
- Eligible?
- —
Personal DTI + credit; lowest rate.
DSCR
20% down · 8.5% · 30yr
- Down + closing
- —
- Monthly P&I
- —
- Monthly cashflow
- —
- DSCR
- —
- Eligible?
- —
No personal income docs; deal must DSCR.
Hard money
10% down · 12.0% · 12mo
- Down + closing
- —
- Monthly P&I
- —
- Monthly cashflow
- —
- DSCR
- —
- Eligible?
- —
Short-term bridge; refi at stabilization.
Rent comps 1 comps
| Address | Beds | Baths | Sqft | Rent | $/sqft | DOM | Units | Dist |
|---|---|---|---|---|---|---|---|---|
| 1753 156th Ln NW Andover, MN | 1.0–2.0 | 1.0–1.5 | 887 | $2,889 | $3.26 | 0d | 3 | 0.78mi |
Listing history 1 events
-
2026-05-07$374,900 Active 535-char remark
ⓘ Source: listings_history table (triggers on properties + properties_extension) + one-shot
backfill from property_details.listing_events for pre-trigger history.
Tax reassessment forecast MN · Partial reset (capped growth)
- Current annual tax
- $2,446 · $204/mo
- Projected year-2 tax
- $3,322 · $277/mo
- Expected delta
- +$877/yr (+$73/mo · 35.8%)
ⓘ Screening estimate from a state-policy table — verify with the county assessor before closing.
Nearby sold comps map
Loading sold comps map…
Walkable amenities ~0.75 mi
Loading nearby amenities…
Taxation est. · year 1
- Rental income
- $34,668
- − Mortgage interest
- −$21,000
- − Property taxes
- −$2,446
- − Insurance
- −$1,874
- − Repairs & maintenance
- −$2,773
- − Management
- −$2,773
- − Depreciation
- −$10,906
- Taxable loss
- −$7,105
- Est. tax savings @ 24.0%
- +$1,705
- After-tax cash flow
- $1,181/yr
For passive investors: Depreciation is non-cash, so a rental often shows a tax loss while cash-flowing — sheltering income. Rental losses are passive: they offset passive income freely, and up to $25,000/yr can offset ordinary (W-2) income if you actively participate and your MAGI is under $100k (phasing out to $0 by $150k); unused losses carry forward. On sale, claimed depreciation is recaptured at up to 25%, and gains may owe capital-gains tax (a 1031 exchange can defer both). Figures are a year-1 estimate at your 24.0% rate — not tax advice; consult a CPA.
Schools (NCES district)
- District
- Anoka-Hennepin Public School District
- NCES district ID
- 2703180
- Math proficiency
- 49% ▼ -14.00%
- Reading proficiency
- 55% ▼ -10.00%
- Median HH income
- $73,837
- Composite
- 46.7/100
- National rank
- #2400
- State rank
- #71 of 301 in MN
Livability — Andover
- Score
- 72/100
- State rank
- #291
- US rank
- #6311
Category grades
Schools grade is shown separately in the Schools card above.
Census & demographics
- Census place
- Andover, MN
- Population (ZIP)
- 49,452
Population outlook (Anoka County) Hauer SSP2
- Today (2025)
- 375,223 people
- By 2030
- 387,850 · +3.4%
- By 2040
- 407,239 · +8.5%
- By 2050
- 417,541 · +11.3%
- By 2075
- 448,447 · +19.5%
- By 2100
- 464,954 · +23.9%
Race, ethnicity, and origin ACS 2023
- Neighborhood character
- Predominantly White (88%)
- Race & ethnicity
- White 88% Two or more races 4% Asian 3% Black 3% Hispanic / Latino 2%
- Common ancestry
- Portuguese 14% Romanian 6% Lithuanian 3%
- Foreign-born
- 5% · Canada
- Languages at home
- 94% English-only · Other Asian/Pacific 2% Spanish 1% Russian/Polish/Slavic 1%
Political lean MEDSL · Anoka
- 2024 margin
- Toss-up / Even · D 46.6% · R 51.0% · Other 2.4%
- 2008→2024 swing
- -2.0pp toward R · 2008: -2.4pp · 2024: -4.4pp
- All cycles
- 2024: R+4.4 2020: R+1.9 2016: R+9.7 2012: R+2.6 2008: R+2.4
Not yet ingested
- Civics
- —
Market trends
- HPI YoY
- ▼ -267.68%
- Current HPI
- 242.7122
- Rent YoY
- —
- Metro
- —
- State GDP YoY
- ▲ 2.41%
- F500 in state
- 34
Industry mix (Fortune 500 HQ in MN)
| Industry | F500 HQs | Revenue |
|---|---|---|
| Healthcare | 2 | $407B |
|
||
| Retail | 2 | $150B |
|
||
| Consumer Goods | 2 | $32B |
|
||
| Industrial Machinery | 2 | $6B |
|
||
| Agriculture | 1 | $40B |
|
||
| Healthcare / Medical Devices | 1 | $32B |
|
||
Price history
2 events — show timeline
- 2026-05-20 Pending — NORTHSTARMLS as Distributed by MLS Grid
- 2026-05-07 Listed $374,900 NORTHSTARMLS as Distributed by MLS Grid
Property tax history
+2.4%/yrLatest (2022): $2,446 · +6.5% YoY. Source: county tax records.
Cash-flow waterfall
monthlySold comps — $/sqft
last 12 mo · ≤1 miLoading sold comps…