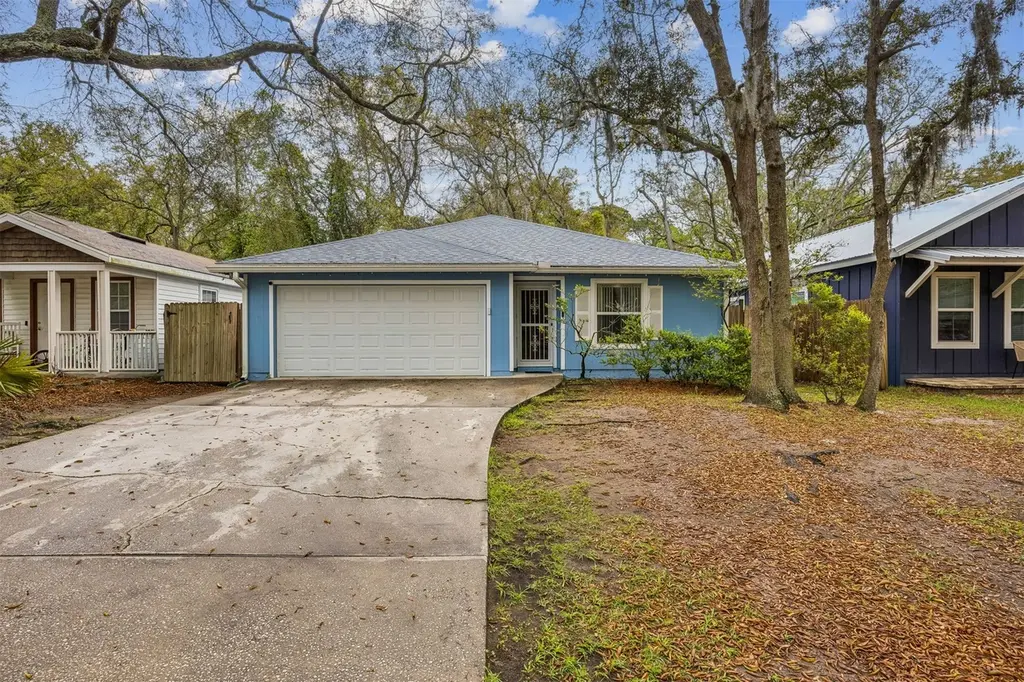
528 S 13th Ter
Fernandina Beach, FL 30234
$425,000D-
3 bd · 2.0 ba ·
1,252 sqft ·
Built 1997
· SingleFamily
· Active
· 74 DOM
Cashflow @ list (25.0% down · 7.5%)
Estimated rent
$2,670/mo
Mortgage (P&I)
−$2,229
Tax + insurance
−$308
HOA
−$0
Vac / Maint / Mgmt
−$561
Net cashflow
$-428/mo
Annual
$-5,135/yr
Cap rate
5.08%
Cash-on-cash
-4.32%
DSCR
0.81
1% rule
0.63%
Cash to close
$119,000
Investor read
- This is a 3-bed/2.0-bath single-family listed at $425k.
- At list price, monthly cash flow is $-428 ($-5k/yr) — negative.
- To cash-flow at today's rent, offer at most $349k (17.8% below list).
- To meet the 1% rule (rent ≥ 1% of price), the offer needs to be $267k (37.2% below list).
- It's been on market 74 days — a 6% lower offer ($400k) is reasonable based on typical stale-listing flexibility.
- Recommended offer: $267k (37.2% below list) — sets the bar for 1% rule.
- In year one you build about $15k of equity ($3k loan paydown + $12k appreciation (2.9% local appreciation)).
- Location reads 72/100 on livability (#369 in FL) — a middle-class / working-renter tenant base. Strengths: schools A+, crime A+, employment A+; Watch: cost of living D, amenities F, commute F.
- Nassau (town): math 74% / reading 65% proficiency, ranked #4 of 73 in FL (top 6%) — acceptable for families but not a draw, mixed tenant base, ~2y average lease.
- Market conditions: 2 active listings in the ZIP; 7 comparable units currently listed for rent nearby; rentals at typical pace (median 18d on market — plan ~3-4 weeks tenant-placement turnaround); 953 units permitted in Nassau County in 2024 (24 in 5+ unit buildings).
- Nassau County population projected at +17% by 2050 — long-run rental-demand tailwind backs the buy-and-hold thesis.
- Current owner paid $165k; list at $425k implies a 158% gain — meaningful room to come down on a strong offer.
- By year 3, paydown + projected appreciation supports a ~$38k cash-out refi (75% LTV) — recoverable capital for the next deal without selling this one.
- Climate carrying-cost: severe wind risk, 99% chance of damaging wind over 30y; extreme-heat days projected 7→20/yr by 2055 (HVAC capex compounding) — expect insurance premiums to compound above CPI over the hold.
- Cap rate 5.1% vs local median 1.2% in Fernandina Beach — top-decile yield for the area; either an underpriced asset or a hidden risk that comps aren't pricing in. Stress-test before assuming the spread holds.
Questions for listing agent
- What do current leases actually rent for vs. the listed asking? Can we see a recent rent roll and the last 12 months of T-12 income?
- It's been on market 74 days. Have you received any prior offers? Is the seller open to a 37% concession, seller financing, or rate buy-down credit?
- Why hasn't it sold? Are there any deal-killer items the seller is aware of (foundation, flood, title, zoning, code violations)?
- Is there a deadline driving the sale (1031 exchange, divorce, estate, relocation)? That informs how much negotiation room exists.
- Schools are A-rated — typically a magnet for longer-tenancy family renters. What's the average tenant stay here, and is there a school-zone premium baked into asking?
- The area grade is low — what's the realistic commute time and amenity access for the typical tenant pool here? Any planned neighborhood developments (good or bad) we should know about?
- What's the average days-on-market for RENTAL listings here right now (not sales)? A rising rental-DOM trend means longer vacancies and softer asking-rent achievability than the comps imply.
- What's the recent tenant-quality profile in this submarket — average credit score on applications, eviction rate, late-payment / NSF rate, and stable-employment percentage? A property-management company in the area should have these aggregated.
CashFlowRE · CFR-CJ6RDZDJCDJHR8
· Data 22 h ago
cashflowre.app · 2026-05-29