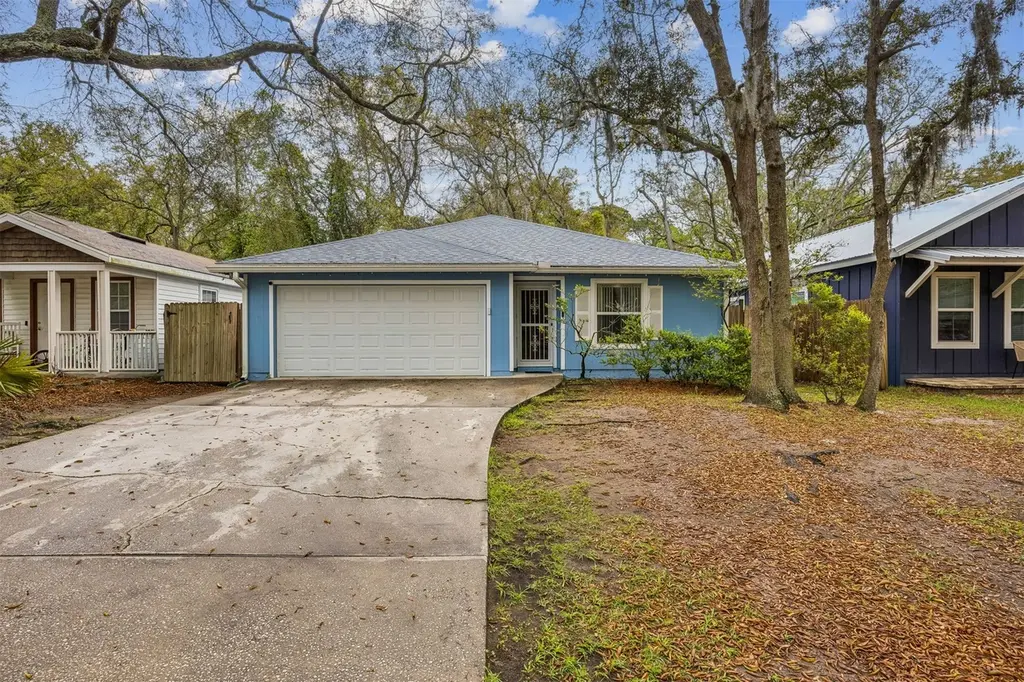
528 S 13th Ter · Fernandina Beach, FL
Flood risk 1/10 · Minimal
- FEMA flood zone
- X (unshaded)
- Chance of flooding over 30 yrs
- 0.0%
- Est. flood insurance / yr
- $507 – $1,088
Fire risk 3/10 · Minor
- Est. fire insurance / yr
- $947 – $1,759
Heat risk 10/10 · Severe
- Hot days now (above 105°F)
- 7 days/yr
- Hot days in 30 yrs
- 20 days/yr
Wind risk 9/10 · Severe
- Chance of severe wind over 30 yrs
- 99.0%
Air-quality risk 4/10 · Minor
- Unhealthy air days now
- 5 days/yr
- Unhealthy air days in 30 yrs
- 5 days/yr
Risk factors via First Street. Map © Google.
Why this score? — see what drove the D- grade
The composite is a weighted blend of 9 inputs, each scored 0–100. Each bar is that input's sub-score; the figure is the points it added to the 100-point composite (weight × sub-score).
- Cash flow +8.0/30.0
- Appreciation +6.5/10.0
- Schools +6.0/10.0
- ARV discount +5.4/15.0
- Livability +3.6/5.0
- Rent growth +2.5/5.0
- Condition / age +2.5/5.0
- DSCR +2.1/10.0
- 1% rule +1.3/10.0
$425,000
🖨 Deal sheet (PDF) 📄 Offer letter ✓ Due diligence
Listing remarks
3-bedroom, 2-bath home on Amelia Island with a 2-car garage in a fantastic central location, just minutes from the beach and Historic Downtown Fernandina. This 1,252-square-foot home features a great layout, with high ceilings in the living room, creating an open, airy feel. The fenced backyard is perfect for entertaining, relaxing, or letting pets play, and includes a shed for additional storage. The roof is less than 4 years old, adding peace of mind for the new owner. Located in sought-after Nassau County with access to A-rated schools, and within walking distance to the middle and high school, this home combines comfort, convenience, and island living.
Key facts
- Shed for storage
- Fenced backyard
- 4,791 sq ft lot
Tags
Property features AI
Exterior
- Parking: Two-car garage with garage door opener
- Utilities: Public water; Public sewer; Cable available
- Home design: Single-story home; Frame construction; Shingle roof; Resale property; Zoned R-2; 50 by 100 lot, paved road access
- Construction: Built by Atlantic Builders Inc
- Exterior features: Fenced yard; Rear porch; Open deck; Patio
Interior
- Kitchen: Dishwasher; Microwave; Refrigerator; Stove; Icemaker
- Bathrooms: 2 full bathrooms
- Heating & cooling: Heat pump heating; Heat pump cooling
- Interior features: Ceiling fans; Cable TV available; Window treatments including blinds and drapes; Aluminum window frames
- Laundry & utility: Washer; Dryer; Owned water softener
Neighborhood map
What this means for you Summary
Snapshot
- This is a 3-bed/2.0-bath single-family listed at $425k.
Deal economics
- At list price, monthly cash flow is $-428 ($-5k/yr) — negative.
- To cash-flow at today's rent, offer at most $349k (17.8% below list).
- To meet the 1% rule (rent ≥ 1% of price), the offer needs to be $267k (37.2% below list).
- Recommended offer: $267k (37.2% below list) — sets the bar for 1% rule.
- Cap rate 5.1% vs local median 1.2% in Fernandina Beach — top-decile yield for the area; either an underpriced asset or a hidden risk that comps aren't pricing in. Stress-test before assuming the spread holds.
Location & tenants
- Location reads 72/100 on livability (#369 in FL) — a middle-class / working-renter tenant base. Strengths: schools A+, crime A+, employment A+; Watch: cost of living D, amenities F, commute F.
- Nassau (town): math 74% / reading 65% proficiency, ranked #4 of 73 in FL (top 6%) — acceptable for families but not a draw, mixed tenant base, ~2y average lease.
- Market conditions: 2 active listings in the ZIP; 7 comparable units currently listed for rent nearby; rentals at typical pace (median 18d on market — plan ~3-4 weeks tenant-placement turnaround); 953 units permitted in Nassau County in 2024 (24 in 5+ unit buildings).
Forward outlook
- In year one you build about $15k of equity ($3k loan paydown + $12k appreciation (2.9% local appreciation)).
- Nassau County population projected at +17% by 2050 — long-run rental-demand tailwind backs the buy-and-hold thesis.
- By year 3, paydown + projected appreciation supports a ~$38k cash-out refi (75% LTV) — recoverable capital for the next deal without selling this one.
Negotiation context
- It's been on market 74 days — a 6% lower offer ($400k) is reasonable based on typical stale-listing flexibility.
- Current owner paid $165k; list at $425k implies a 158% gain — meaningful room to come down on a strong offer.
Risks & watch-outs
- Climate carrying-cost: severe wind risk, 99% chance of damaging wind over 30y; extreme-heat days projected 7→20/yr by 2055 (HVAC capex compounding) — expect insurance premiums to compound above CPI over the hold.
Questions for the listing agent
- What do current leases actually rent for vs. the listed asking? Can we see a recent rent roll and the last 12 months of T-12 income?
- It's been on market 74 days. Have you received any prior offers? Is the seller open to a 37% concession, seller financing, or rate buy-down credit?
- Why hasn't it sold? Are there any deal-killer items the seller is aware of (foundation, flood, title, zoning, code violations)?
- Is there a deadline driving the sale (1031 exchange, divorce, estate, relocation)? That informs how much negotiation room exists.
- Schools are A-rated — typically a magnet for longer-tenancy family renters. What's the average tenant stay here, and is there a school-zone premium baked into asking?
- The area grade is low — what's the realistic commute time and amenity access for the typical tenant pool here? Any planned neighborhood developments (good or bad) we should know about?
- What's the average days-on-market for RENTAL listings here right now (not sales)? A rising rental-DOM trend means longer vacancies and softer asking-rent achievability than the comps imply.
- What's the recent tenant-quality profile in this submarket — average credit score on applications, eviction rate, late-payment / NSF rate, and stable-employment percentage? A property-management company in the area should have these aggregated.
- How much new for-sale + rental construction is in the pipeline within 1–3 miles? Heavy new supply typically softens prices + rents 12–24 months out; constrained supply supports both.
Investment metrics
- 1% rule
- 0.63% ✗
- Cap rate
- 5.08%
- Cash-on-cash
- -4.32%
- DSCR
- 0.81
- GRM
- 13.3
CMA / ARV
- ARV (on-the-fly)
- $405,648
- Comps found
- 12
Show comp detail 12 sales within ~0.75 mi
| Address | Dist | Beds/Ba | Sqft | Sold | Price | $/sf | Match |
|---|---|---|---|---|---|---|---|
| 619 S 14 St | 0.08mi | 3/1.0 | 1,231 (-2%) | 1mo | $320,000 | $260 | 88 |
| 419 S 12th St | 0.21mi | 3/2.0 | 1,325 (+6%) | 4mo | $200,000 | $151 | 77 |
| 929 S 9th St | 0.50mi | 3/2.0 | 1,252 (0%) | 3mo | $452,400 | $361 | 74 |
| 728 9th St | 0.38mi | 4/2.0 (+1) | 1,276 (+2%) | 2mo | $220,000 | $172 | 72 |
| 728 9th St #A&B | 0.38mi | 4/2.0 (+1) | 1,276 (+2%) | 2mo | $220,000 | $172 | 72 |
| 112 S 14th | 0.41mi | 3/2.0 | 1,360 (+9%) | 4mo | $400,000 | $294 | 64 |
| 1120 Natures Walk Dr #A | 0.64mi | 2/2.0 (-1) | 1,274 (+2%) | 0mo | $419,000 | $329 | 62 |
| 710 S 7th St | 0.47mi | 3/2.5 | 1,391 (+11%) | 1mo | $450,000 | $324 | 57 |
| 1314 Beech St | 0.31mi | 2/2.0 (-1) | 1,085 (-13%) | 4mo | $545,000 | $502 | 55 |
| 73 Oak Grove Pl | 0.38mi | 2/1.0 (-1) | 1,095 (-12%) | 3mo | $365,000 | $333 | 50 |
| 19 Oak Grove Pl | 0.45mi | 2/1.0 (-1) | 1,086 (-13%) | 3mo | $300,000 | $276 | 45 |
| 429 S 5th St | 0.58mi | 2/2.5 (-1) | 1,437 (+15%) | 2mo | $710,000 | $494 | 40 |
Match score weights: distance 35% · size 25% · config 20% · recency 20%. Top-matched comps best support the ARV.
Projected returns pro-forma
2.91% appreciation · 3.0% rent growth · sell at horizon
- IRR
- 3.2%
- Equity multiple
- 1.18×
- Total profit
- $21,763
- Equity at exit
- $188,997
- IRR
- 6.6%
- Equity multiple
- 1.99×
- Total profit
- $117,915
- Equity at exit
- $289,644
Cash invested: $119,000 (down + closing). Projections, not guarantees.
Landlord ↔ Tenant lean methodology
- Overall (STATE)
- 87 Strongly Landlord-Friendly
- State Florida
- 87 Strongly Landlord-Friendly · R+3
- County
- — inherits STATE
- City
- — inherits STATE
ZIP-level market 30234
- Home prices YoY
- 0.8%
- Active inventory
- 2
- Price-to-rent
- 13.3×
Monthly cashflow live
- Estimated rent
- $2,670 high interval (Pro) →
- Mortgage (P&I)
- −$2,229
- Tax from tax record
- −$131 /mo · $1,575/yr
- Insurance
- −$177
- HOA
- −$0
- Vacancy / Maint / Mgmt
- −$561
- Net cashflow
- $-428
Break-even live
Sensitivity live
| Price | -10% $-187 | -5% $-308 | +0% $-428 | +5% $-548 | +10% $-668 |
|---|---|---|---|---|---|
| Rent | -10% $-639 | -5% $-533 | +0% $-428 | +5% $-322 | +10% $-217 |
| Rate | -1.0pp $-214 | -0.5pp $-320 | base $-428 | +0.5pp $-538 | +1.0pp $-650 |
UW: 25.0% down · 7.5% · 30yr · 1.5% tax · 5.0% vac · 8.0% maint · 8.0% mgmt
Financing live
Cash to close
- Down payment
- $106,250
- Closing costs
- $12,750
- Reserves months
- —
- Total cash needed
- —
Loan-product check · same deal, 3 products live
Conventional
25% down · 7.5% · 30yr
- Down + closing
- —
- Monthly P&I
- —
- Monthly cashflow
- —
- DSCR
- —
- Eligible?
- —
Personal DTI + credit; lowest rate.
DSCR
20% down · 8.5% · 30yr
- Down + closing
- —
- Monthly P&I
- —
- Monthly cashflow
- —
- DSCR
- —
- Eligible?
- —
No personal income docs; deal must DSCR.
Hard money
10% down · 12.0% · 12mo
- Down + closing
- —
- Monthly P&I
- —
- Monthly cashflow
- —
- DSCR
- —
- Eligible?
- —
Short-term bridge; refi at stabilization.
Rent comps 7 comps
| Address | Beds | Baths | Sqft | Rent | $/sqft | DOM | Units | Dist |
|---|---|---|---|---|---|---|---|---|
| 716 S 15th St Fernandina Beach, FL | 2.0 | 2.0 | 1152 | $2,900 | $2.52 | 25d | 1 | 0.22mi |
| 216 Citrona Dr Fernandina Beach, FL | 3.0 | 2.0 | 1125 | $2,600 | $2.31 | 16d | 1 | 0.59mi |
| 514 S 4th St Unit B Fernandina Beach, FL | 2.0 | 2.0 | 1000 | $3,000 | $3.00 | 6d | 1 | 0.59mi |
| 1502 Broome St Fernandina Beach, FL | 3.0 | 1.0 | 1199 | $2,250 | $1.88 | 25d | 1 | 0.68mi |
| 724 N 14th St Fernandina Beach, FL | 3.0 | 2.0 | 1008 | $2,495 | $2.48 | 17d | 1 | 1.15mi |
| 57 S Fletcher Ave Unit A2 Fernandina Beach, FL | 2.0 | 1.0 | 1025 | $2,450 | $2.39 | 25d | 1 | 1.23mi |
| 631 Tarpon Ave Fernandina Beach, FL | 2.0 | 1.0 | 1053 | $1,900 | $1.80 | 16d | 1 | 1.48mi |
Listing history 22 events
-
2026-06-21days on market $425,000 Active 74 DOM
-
2026-06-18days on market $425,000 Active 71 DOM
-
2026-06-17days on market $425,000 Active 70 DOM
-
2026-06-16days on market $425,000 Active 69 DOM
-
2026-06-15days on market $425,000 Active 68 DOM
-
2026-06-13days on market $425,000 Active 66 DOM
-
2026-06-13days on market $425,000 Active 65 DOM
-
2026-06-09days on market $425,000 Active 62 DOM
-
2026-06-08days on market $425,000 Active 61 DOM
-
2026-06-07days on market $425,000 Active 60 DOM
-
2026-06-05days on market $425,000 Active 57 DOM
-
2026-06-03days on market $425,000 Active 56 DOM
-
2026-06-02days on market $425,000 Active 55 DOM
-
2026-06-01days on market $425,000 Active 54 DOM
-
2026-05-31days on market $425,000 Active 53 DOM
-
2026-05-19price $425,000
-
2026-04-08$450,000 Active
-
2023-01-10soldstatus $165,000
-
1999-05-24soldstatus $12,900
-
1998-12-29soldstatus $123,500
-
1997-03-04soldstatus $72,300
-
1996-11-27soldstatus $22,500
ⓘ Source: listings_history table (triggers on properties + properties_extension) + one-shot
backfill from property_details.listing_events for pre-trigger history.
Tax reassessment forecast FL · Resets to sale price
- Current annual tax
- $1,575 · $131/mo
- Projected year-2 tax
- $3,528 · $294/mo
- Expected delta
- +$1,953/yr (+$163/mo · 124.0%)
ⓘ Screening estimate from a state-policy table — verify with the county assessor before closing.
Climate risk First Street
- Flood 1/10 Low FEMA zone X (unshaded) · 0% chance over 30 yrs
- Wildfire 3/10 Moderate
- Heat 10/10 Extreme 7 d/yr ≥105°F today · 20 d/yr by 30 yrs out
- Wind 9/10 Extreme 99% chance of damaging wind over 30 yrs
- Air quality 4/10 Moderate 5 unhealthy d/yr today · 5 by 30 yrs out
Nearby sold comps map
Loading sold comps map…
Walkable amenities ~0.75 mi
Loading nearby amenities…
Taxation est. · year 1
- Rental income
- $32,038
- − Mortgage interest
- −$23,807
- − Property taxes
- −$1,575
- − Insurance
- −$2,125
- − Repairs & maintenance
- −$2,563
- − Management
- −$2,563
- − Depreciation
- −$12,364
- Taxable loss
- −$12,958
- Est. tax savings @ 24.0%
- +$3,110
- After-tax cash flow
- $-2,025/yr
For passive investors: Depreciation is non-cash, so a rental often shows a tax loss while cash-flowing — sheltering income. Rental losses are passive: they offset passive income freely, and up to $25,000/yr can offset ordinary (W-2) income if you actively participate and your MAGI is under $100k (phasing out to $0 by $150k); unused losses carry forward. On sale, claimed depreciation is recaptured at up to 25%, and gains may owe capital-gains tax (a 1031 exchange can defer both). Figures are a year-1 estimate at your 24.0% rate — not tax advice; consult a CPA.
Schools (NCES district)
- District
- Nassau
- NCES district ID
- 1201350
- Math proficiency
- 74% ▼ -2.00%
- Reading proficiency
- 65% ▼ -2.00%
- Median HH income
- $58,267
- Composite
- 59.79/100
- National rank
- #899
- State rank
- #4 of 73 in FL
Livability — Fernandina Beach
- Score
- 72/100
- State rank
- #369
- US rank
- #6484
Category grades
Schools grade is shown separately in the Schools card above.
Census & demographics
- Census place
- Fernandina Beach, FL
- City population
- 41,029
- Population (ZIP)
- 1,920
Population outlook (Nassau County) Hauer SSP2
- Today (2025)
- 88,419 people
- By 2030
- 92,679 · +4.8%
- By 2040
- 99,257 · +12.3%
- By 2050
- 103,378 · +16.9%
- By 2075
- 109,726 · +24.1%
- By 2100
- 107,006 · +21.0%
Race, ethnicity, and origin ACS 2023
- Neighborhood character
- Majority Black (64%)
- Race & ethnicity
- Black 64% White 32% Two or more races 3%
- Common ancestry
- Italian 1% Serbian 1%
- Foreign-born
- 0%
- Languages at home
- 99% English-only · Spanish 1%
Political lean MEDSL · Nassau
- 2024 margin
- Solid R (+46.9) · D 26.1% · R 73.1%
- 2008→2024 swing
- -3.1pp toward R · 2008: -43.8pp · 2024: -46.9pp
- All cycles
- 2024: R+46.9 2020: R+45.9 2016: R+50.2 2012: R+48.6 2008: R+43.8
Not yet ingested
- Civics
- —
Market trends
- HPI YoY
- ▲ 2.91%
- Current HPI
- 358.7694
- Rent YoY
- —
- Metro
- —
- State GDP YoY
- ▲ 3.28%
- F500 in state
- 36
Industry mix (Fortune 500 HQ in FL)
| Industry | F500 HQs | Revenue |
|---|---|---|
| Industrial Technology | 2 | $29B |
|
||
| Insurance | 2 | $17B |
|
||
| Retail | 1 | $60B |
|
||
| Technology Distribution | 1 | $58B |
|
||
| Homebuilding | 1 | $35B |
|
||
| Technology Manufacturing | 1 | $35B |
|
||
Price history
+1788.9% since first listed7 events — show timeline
- 2026-05-19 Price Changed $425,000 AINCAR
- 2026-04-08 Listed $450,000 AINCAR
- 2023-01-10 Sold (Public Records) $165,000 Public Records
- 1999-05-24 Sold (Public Records) $12,900 Public Records
- 1998-12-29 Sold (Public Records) $123,500 Public Records
- 1997-03-04 Sold (Public Records) $72,300 Public Records
- 1996-11-27 Sold (Public Records) $22,500 Public Records
Property tax history
+2.0%/yrLatest (2025): $1,575 · +2.1% YoY. Source: county tax records.
Cash-flow waterfall
monthlySold comps — $/sqft
last 12 mo · ≤1 miLoading sold comps…