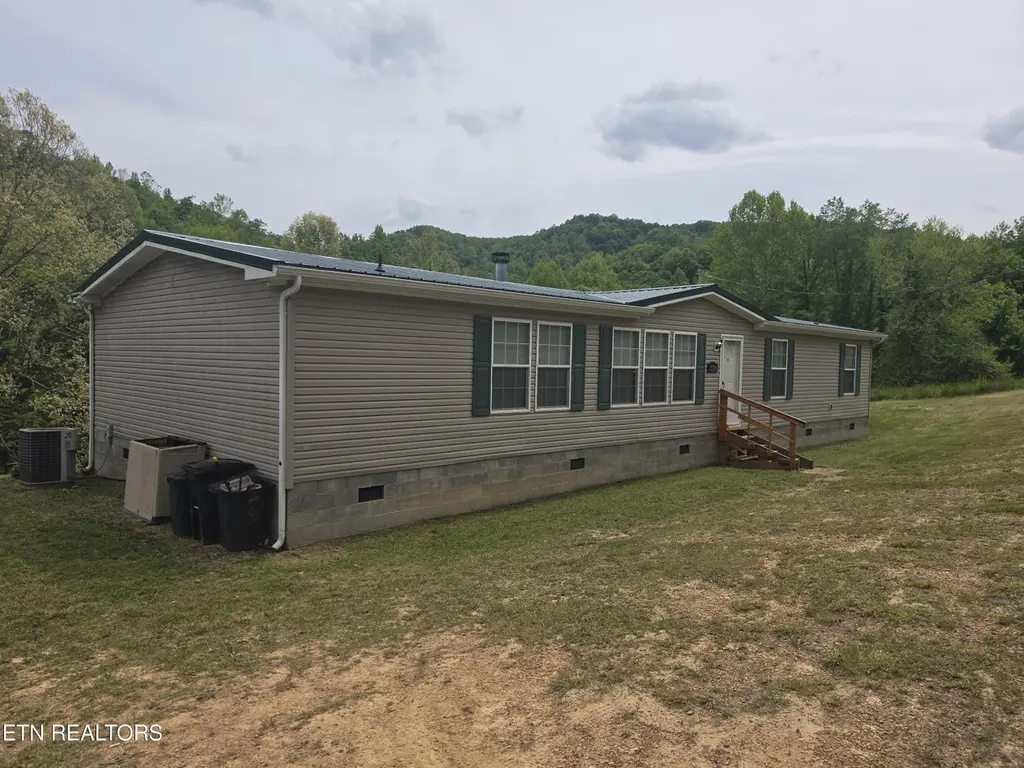
13179 State Highway 190
Pineville, KY 40977
$150,000D
3 bd · 3.0 ba ·
1,904 sqft ·
Built 2007
· Other
· Active
· 41 DOM
Cashflow @ list (25.0% down · 7.5%)
Estimated rent
$1,132/mo
Mortgage (P&I)
−$787
Tax + insurance
−$118
HOA
−$0
Vac / Maint / Mgmt
−$238
Net cashflow
$-10/mo
Annual
$-124/yr
Cap rate
6.21%
Cash-on-cash
-0.29%
DSCR
0.99
1% rule
0.75%
Cash to close
$42,000
Investor read
- This is a 3-bed/3.0-bath other listed at $150k.
- At list price, monthly cash flow is $-10 ($-124/yr) — negative.
- To cash-flow at today's rent, offer at most $148k (1.2% below list).
- To meet the 1% rule (rent ≥ 1% of price), the offer needs to be $113k (24.5% below list).
- It's been on market 41 days — a 3% lower offer ($146k) is reasonable based on typical stale-listing flexibility.
- Recommended offer: $113k (24.5% below list) — sets the bar for 1% rule.
- Local home prices are declining (-1.3%/yr); year-one equity from $1k of loan paydown is wiped out by about $2k of value loss. Plan a longer hold.
- Location reads 68/100 on livability (#195 in KY) — a middle-class / working-renter tenant base. Strengths: crime A+, cost of living A+, health & safety A-; Watch: amenities F, commute F, employment F.
- Bell County (rural): math 27% / reading 40% proficiency, ranked #91 of 165 in KY (top 55%) — families likely to look elsewhere, expect single-tenant / working-renter base with shorter leases; 71% free/reduced lunch — lower-income household profile, screen leases tightly.
- Zoned schools: Yellow Creek School Center (math 23% / reading 39%, grade F, #378 of 676 statewide, top 57%, 559 students, 83% FRL); Bell County High School (math 32% / reading 42%, grade F, #58 of 254 statewide, top 27%, 695 students, 74% FRL).
- Market conditions: 33 active listings in the ZIP; 44 units permitted in Bell County in 2024 (0 in 5+ unit buildings).
- Bell County population projected at -30% by 2050 — secular population decline; favor cash flow + early exit over multi-decade hold.
- Climate carrying-cost: major wildfire risk — expect insurance premiums to compound above CPI over the hold.
Questions for listing agent
- What do current leases actually rent for vs. the listed asking? Can we see a recent rent roll and the last 12 months of T-12 income?
- It's been on market 41 days. Have you received any prior offers? Is the seller open to a 25% concession, seller financing, or rate buy-down credit?
- Is there a deadline driving the sale (1031 exchange, divorce, estate, relocation)? That informs how much negotiation room exists.
- Schools are D-rated, which usually means shorter tenancies and higher turnover. Who's the typical renter profile here, and what's been the actual vacancy rate?
- The area grade is low — what's the realistic commute time and amenity access for the typical tenant pool here? Any planned neighborhood developments (good or bad) we should know about?
- What's the average days-on-market for RENTAL listings here right now (not sales)? A rising rental-DOM trend means longer vacancies and softer asking-rent achievability than the comps imply.
- What's the recent tenant-quality profile in this submarket — average credit score on applications, eviction rate, late-payment / NSF rate, and stable-employment percentage? A property-management company in the area should have these aggregated.
- How much new for-sale + rental construction is in the pipeline within 1–3 miles? Heavy new supply typically softens prices + rents 12–24 months out; constrained supply supports both.
CashFlowRE · CFR-CJSTX55PB6945A
· Data 4 h ago
cashflowre.app · 2026-05-29