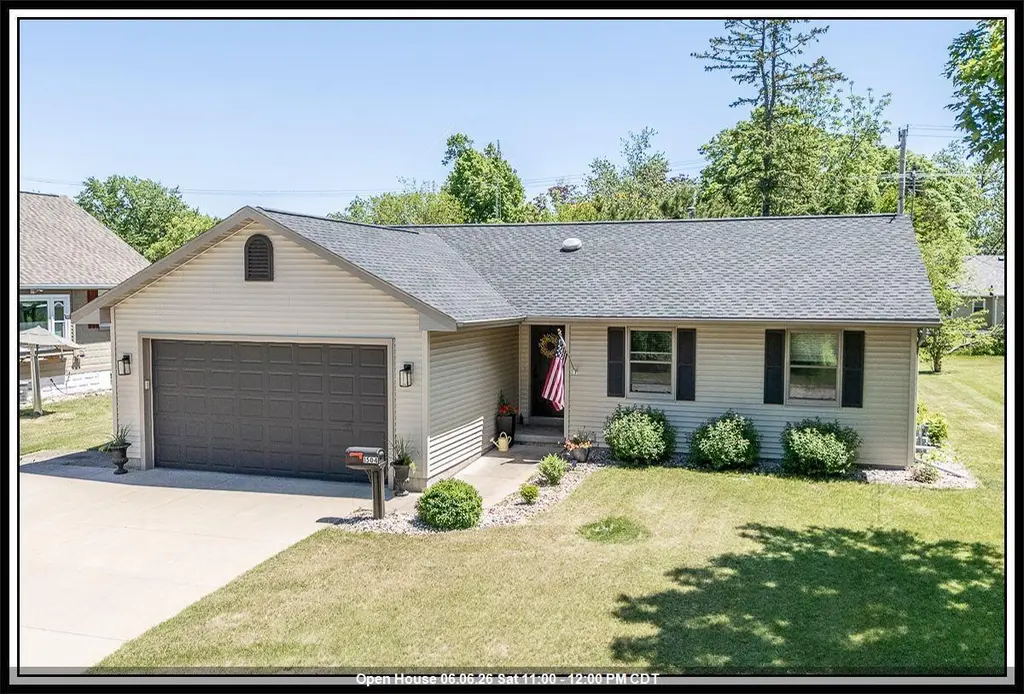
1504 Smith St
New London, WI 54961
$309,900F
3 bd · 2.5 ba ·
1,758 sqft ·
Built 1997
· SingleFamily
· Active
· 15 DOM
Cashflow @ list (25.0% down · 7.5%)
Estimated rent
$2,588/mo
Mortgage (P&I)
−$1,625
Tax + insurance
−$425
HOA
−$0
Vac / Maint / Mgmt
−$543
Net cashflow
$-6/mo
Annual
$-74/yr
Cap rate
6.27%
Cash-on-cash
-0.09%
DSCR
1.00
1% rule
0.83%
Cash to close
$86,772
Investor read
- This is a 3-bed/2.5-bath single-family listed at $310k.
- At list price, monthly cash flow is $-6 ($-74/yr) — negative.
- To cash-flow at today's rent, offer at most $309k (0.4% below list).
- To meet the 1% rule (rent ≥ 1% of price), the offer needs to be $259k (16.5% below list).
- It's been on market 15 days — a 2% lower offer ($305k) is reasonable based on typical stale-listing flexibility.
- Recommended offer: $259k (16.5% below list) — sets the bar for 1% rule.
- Local home prices are declining (-3.0%/yr); year-one equity from $2k of loan paydown is wiped out by about $9k of value loss. Plan a longer hold.
- Location reads 71/100 on livability (#268 in WI) — a middle-class / working-renter tenant base. Strengths: crime A+, cost of living A+, housing A+; Watch: schools D+, amenities F, commute F.
- New London School District (town): math 48% / reading 37% proficiency, ranked #120 of 342 in WI (top 35%) — families likely to look elsewhere, expect single-tenant / working-renter base with shorter leases.
- Market conditions: 39 active listings in the ZIP; 2 comparable units currently listed for rent nearby; 287 units permitted in Waupaca County in 2024 (173 in 5+ unit buildings).
- Waupaca County population projected at -14% by 2050 — secular population decline; favor cash flow + early exit over multi-decade hold.
- Current owner paid $125k; list at $310k implies a 148% gain — meaningful room to come down on a strong offer.
- Cap rate 6.3% vs local median 4.9% in New London — meaningfully above typical; check what's discounted (condition, days-on-market, listing class) to confirm the premium yield is real.
Questions for listing agent
- What do current leases actually rent for vs. the listed asking? Can we see a recent rent roll and the last 12 months of T-12 income?
- Is there a deadline driving the sale (1031 exchange, divorce, estate, relocation)? That informs how much negotiation room exists.
- Schools are D-rated, which usually means shorter tenancies and higher turnover. Who's the typical renter profile here, and what's been the actual vacancy rate?
- The area grade is low — what's the realistic commute time and amenity access for the typical tenant pool here? Any planned neighborhood developments (good or bad) we should know about?
- What's the average days-on-market for RENTAL listings here right now (not sales)? A rising rental-DOM trend means longer vacancies and softer asking-rent achievability than the comps imply.
- What's the recent tenant-quality profile in this submarket — average credit score on applications, eviction rate, late-payment / NSF rate, and stable-employment percentage? A property-management company in the area should have these aggregated.
- How much new for-sale + rental construction is in the pipeline within 1–3 miles? Heavy new supply typically softens prices + rents 12–24 months out; constrained supply supports both.
CashFlowRE · CFR-CJY52QFS9EEC2W
· Data 2 days ago
cashflowre.app · 2026-05-29