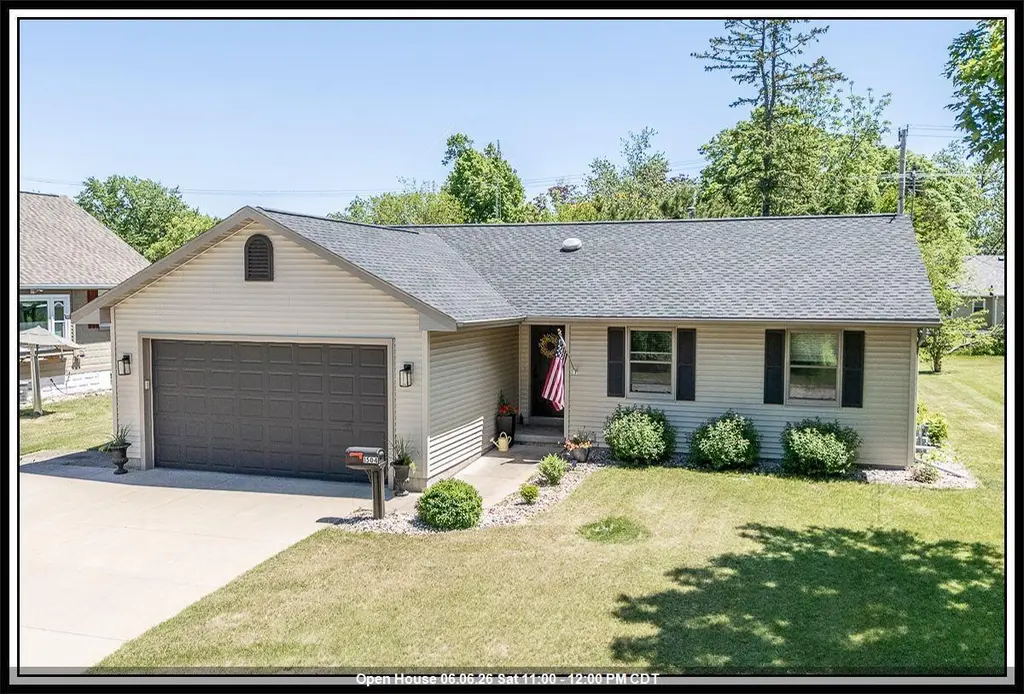
1504 Smith St · New London, WI
Flood risk 1/10 · Minimal
- FEMA flood zone
- X (unshaded)
- Chance of flooding over 30 yrs
- 0.0%
- Est. flood insurance / yr
- $473 – $860
Fire risk 3/10 · Minor
- Est. fire insurance / yr
- $636 – $1,182
Heat risk 2/10 · Minimal
- Hot days now (above 98°F)
- 7 days/yr
- Hot days in 30 yrs
- 12 days/yr
Wind risk 2/10 · Minimal
- Chance of severe wind over 30 yrs
- —
Air-quality risk 2/10 · Minimal
- Unhealthy air days now
- 1 days/yr
- Unhealthy air days in 30 yrs
- 1 days/yr
Risk factors via First Street. Map © Google.
Why this score? — see what drove the F grade
The composite is a weighted blend of 9 inputs, each scored 0–100. Each bar is that input's sub-score; the figure is the points it added to the 100-point composite (weight × sub-score).
- Cash flow +13.2/30.0
- DSCR +4.0/10.0
- Schools +3.7/10.0
- Livability +3.6/5.0
- 1% rule +3.3/10.0
- Rent growth +2.5/5.0
- Condition / age +2.5/5.0
- ARV discount +1.7/15.0
- Appreciation +0.0/10.0
$309,900
🖨 Deal sheet 📄 Offer letter ✓ Due diligence
Listing remarks
FEELS SOOO GOOD to step in the Front Door and feel the "WOW" in this FRESHLY UPDATED OPEN CONCEPT Ranch Beauty w/ 2 Car ATT Garage! NEW Luxury Vinyl Flooring throughout LR w/ Vaulted Ceilings & gas FP, Kitchen w/ Fresh Decor, APPL INCL, Brkfst Bar & Wall Pantry overlooking Dining Area w/ Patio Access to a manicured back yard! GORGEOUS Primary Bedroom w/ Walk-In Closet PLUS 2 SPACIOUS Bedrooms & ADDT Full Bath PLUS 1/2 Bath all on the Main Level! NEED MORE SPACE? LL w/ FAM/GAME/REC Rm (with 1 painted wall), ADDT 'Flex Space', Office or 4th Bedroom(add an egress with 1 painted wall) PLUS ANOTHER FULL BATH! HUGE Storage Room for all the 'Stuff', Exercise area &
Key facts
- Manicured back yard
- Open concept
- Flex space
Tags
Property features AI
Finance
- Other: Lot size approximately 0.16 acres; Zoned residential
Exterior
- Parking: Attached 2-car garage with opener
- Utilities: Municipal water; Municipal sewer; Natural gas
- Home design: Single-family home; One story; Construction completed
- Construction: Finished above-grade living space approximately 1,208; Finished below-grade space approximately 550; Built (year per assessor/public record)
- Exterior features: Patio; Vinyl exterior
Interior
- Kitchen: Dishwasher; Range/Oven; Microwave; Refrigerator; Breakfast bar
- Bedrooms: Primary bedroom (Main) — 14 x 12; Bedroom 2 (Main) — 11 x 10; Bedroom 3 (Main) — 11 x 10
- Bathrooms: Two full bathrooms; One half bathroom; At least one tub
- Heating & cooling: Forced air heat (natural gas); Central air conditioning
- Interior features: Cable/Satellite available; High-speed internet available; Cathedral/vaulted ceilings; Walk-in closet(s)
- Laundry & utility: Washer; Dryer
Neighborhood map
What this means for you Summary
Snapshot
- This is a 3-bed/2.5-bath single-family listed at $310k.
Deal economics
- At list price, monthly cash flow is $-6 ($-74/yr) — negative.
- To cash-flow at today's rent, offer at most $309k (0.4% below list).
- To meet the 1% rule (rent ≥ 1% of price), the offer needs to be $259k (16.5% below list).
- Recommended offer: $259k (16.5% below list) — sets the bar for 1% rule.
- Cap rate 6.3% vs local median 4.9% in New London — meaningfully above typical; check what's discounted (condition, days-on-market, listing class) to confirm the premium yield is real.
Location & tenants
- Location reads 71/100 on livability (#268 in WI) — a middle-class / working-renter tenant base. Strengths: crime A+, cost of living A+, housing A+; Watch: schools D+, amenities F, commute F.
- New London School District (town): math 48% / reading 37% proficiency, ranked #120 of 342 in WI (top 35%) — families likely to look elsewhere, expect single-tenant / working-renter base with shorter leases.
- Market conditions: 39 active listings in the ZIP; 2 comparable units currently listed for rent nearby; 287 units permitted in Waupaca County in 2024 (173 in 5+ unit buildings).
Forward outlook
- Local home prices are declining (-3.0%/yr); year-one equity from $2k of loan paydown is wiped out by about $9k of value loss. Plan a longer hold.
- Waupaca County population projected at -14% by 2050 — secular population decline; favor cash flow + early exit over multi-decade hold.
Negotiation context
- It's been on market 15 days — a 2% lower offer ($305k) is reasonable based on typical stale-listing flexibility.
- Current owner paid $125k; list at $310k implies a 148% gain — meaningful room to come down on a strong offer.
Questions for the listing agent
- What do current leases actually rent for vs. the listed asking? Can we see a recent rent roll and the last 12 months of T-12 income?
- Is there a deadline driving the sale (1031 exchange, divorce, estate, relocation)? That informs how much negotiation room exists.
- Schools are D-rated, which usually means shorter tenancies and higher turnover. Who's the typical renter profile here, and what's been the actual vacancy rate?
- The area grade is low — what's the realistic commute time and amenity access for the typical tenant pool here? Any planned neighborhood developments (good or bad) we should know about?
- What's the average days-on-market for RENTAL listings here right now (not sales)? A rising rental-DOM trend means longer vacancies and softer asking-rent achievability than the comps imply.
- What's the recent tenant-quality profile in this submarket — average credit score on applications, eviction rate, late-payment / NSF rate, and stable-employment percentage? A property-management company in the area should have these aggregated.
- How much new for-sale + rental construction is in the pipeline within 1–3 miles? Heavy new supply typically softens prices + rents 12–24 months out; constrained supply supports both.
Investment metrics
- 1% rule
- 0.83% ✗
- Cap rate
- 6.27%
- Cash-on-cash
- -0.09%
- DSCR
- 1.00
- GRM
- 10.0
CMA / ARV
- ARV (on-the-fly)
- $274,248
- Comps found
- 12
Show comp detail 12 sales within ~0.75 mi
| Address | Dist | Beds/Ba | Sqft | Sold | Price | $/sf | Match |
|---|---|---|---|---|---|---|---|
| 1210 S Pearl St | 0.19mi | 3/1.5 | 1,802 (+2%) | 8mo | $262,500 | $146 | 76 |
| 413 Douglas St | 0.37mi | 4/2.0 (+1) | 1,754 (-0%) | 8mo | $217,900 | $124 | 68 |
| 828 W Warren St | 0.46mi | 3/2.0 | 1,655 (-6%) | 1mo | $267,500 | $162 | 66 |
| 610 W Pine St | 0.43mi | 2/2.0 (-1) | 1,781 (+1%) | 7mo | $295,000 | $166 | 65 |
| 1930 Southland Ln | 0.61mi | 3/2.0 | 1,763 (+0%) | 8mo | $400,000 | $227 | 63 |
| 1202 S Pearl St | 0.21mi | 3/3.0 | 2,016 (+15%) | 2mo | $250,000 | $124 | 62 |
| 713 Nassau St | 0.49mi | 3/1.0 | 1,821 (+4%) | 6mo | $275,000 | $151 | 60 |
| 1931 Southland Ln | 0.61mi | 3/2.0 | 1,651 (-6%) | 2mo | $420,000 | $254 | 58 |
| 514 E Pine St | 0.52mi | 3/1.0 | 1,560 (-11%) | 3mo | $144,000 | $92 | 48 |
| 1927 Southland Ln | 0.59mi | 3/2.0 | 1,506 (-14%) | 2mo | $407,159 | $270 | 45 |
| 624 E Quincy St | 0.65mi | 3/2.0 | 1,536 (-13%) | 3mo | $240,000 | $156 | 44 |
| 111 E Beacon Ave | 0.60mi | 3/1.0 | 1,538 (-12%) | 4mo | $109,900 | $71 | 42 |
Match score weights: distance 35% · size 25% · config 20% · recency 20%. Top-matched comps best support the ARV.
Projected returns pro-forma
-3.0% appreciation · 3.0% rent growth · sell at horizon
- IRR
- -16.5%
- Equity multiple
- 0.42×
- Total profit
- $-50,628
- Equity at exit
- $46,207
- IRR
- -8.2%
- Equity multiple
- 0.49×
- Total profit
- $-44,663
- Equity at exit
- $26,794
Cash invested: $86,772 (down + closing). Projections, not guarantees.
Landlord ↔ Tenant lean methodology
- Overall (STATE)
- 73 Landlord-Friendly
- State Wisconsin
- 73 Landlord-Friendly · R+2
- County
- — inherits STATE
- City
- — inherits STATE
ZIP-level market 54961
- Home prices YoY
- -32.2%
- Active inventory
- 39
- Price-to-rent
- 10.0×
Monthly cashflow live
- Estimated rent
- $2,588 medium interval (Pro) →
- Mortgage (P&I)
- −$1,625
- Tax from tax record
- −$296 /mo · $3,552/yr
- Insurance
- −$129
- HOA
- −$0
- Vacancy / Maint / Mgmt
- −$543
- Net cashflow
- $-6
Break-even live
UW: 25.0% down · 7.5% · 30yr · 1.5% tax · 5.0% vac · 8.0% maint · 8.0% mgmt
Financing live
Cash to close
- Down payment
- $77,475
- Closing costs
- $9,297
- Reserves months
- —
- Total cash needed
- —
Loan-product check · same deal, 3 products live
Conventional
25% down · 7.5% · 30yr
- Down + closing
- —
- Monthly P&I
- —
- Monthly cashflow
- —
- DSCR
- —
- Eligible?
- —
Personal DTI + credit; lowest rate.
DSCR
20% down · 8.5% · 30yr
- Down + closing
- —
- Monthly P&I
- —
- Monthly cashflow
- —
- DSCR
- —
- Eligible?
- —
No personal income docs; deal must DSCR.
Hard money
10% down · 12.0% · 12mo
- Down + closing
- —
- Monthly P&I
- —
- Monthly cashflow
- —
- DSCR
- —
- Eligible?
- —
Short-term bridge; refi at stabilization.
Rent comps 2 comps
| Address | Beds | Baths | Sqft | Rent | $/sqft | DOM | Units | Dist |
|---|---|---|---|---|---|---|---|---|
| 305 W Wolf River Ave Unit WR 305-410 New London, WI | 2.0 | 2.0 | 1279 | $2,625 | $2.05 | 21d | 1 | 0.80mi |
| 305 W Wolf River Ave Unit WR 305-210 New London, WI | 2.0 | 2.0 | 1279 | $2,550 | $1.99 | 21d | 1 | 0.80mi |
Listing history 14 events
-
2026-06-18days on market $309,900 Active 15 DOM
-
2026-06-17days on market $309,900 Active 14 DOM
-
2026-06-16days on market $309,900 Active 13 DOM
-
2026-06-16price $309,900 Active 12 DOM
-
2026-06-15days on market $319,900 Active 12 DOM
-
2026-06-15days on market $319,900 Active 11 DOM
-
2026-06-13days on market $319,900 Active 10 DOM
-
2026-06-12days on market $319,900 Active 9 DOM
-
2026-06-09days on market $319,900 Active 6 DOM
-
2026-06-08days on market $319,900 Active 5 DOM
-
2026-06-08days on market $319,900 Active 4 DOM
-
2026-06-05days on market $319,900 Active 2 DOM
-
2026-06-04remarks 677-char remark
-
2026-06-04$319,900 Active 1 DOM
ⓘ Source: listings_history table (triggers on properties + properties_extension) + one-shot
backfill from property_details.listing_events for pre-trigger history.
Tax reassessment forecast WI · Partial reset (capped growth)
- Current annual tax
- $3,552 · $296/mo
- Projected year-2 tax
- $4,643 · $387/mo
- Expected delta
- +$1,090/yr (+$91/mo · 30.7%)
ⓘ Screening estimate from a state-policy table — verify with the county assessor before closing.
Climate risk First Street
- Flood 1/10 Low FEMA zone X (unshaded) · 0% chance over 30 yrs
- Wildfire 3/10 Moderate
- Heat 2/10 Low 7 d/yr ≥98°F today · 12 d/yr by 30 yrs out
- Wind 2/10 Low
- Air quality 2/10 Low 1 unhealthy d/yr today · 1 by 30 yrs out
Nearby sold comps map
Loading sold comps map…
Walkable amenities ~0.75 mi
Loading nearby amenities…
Taxation est. · year 1
- Rental income
- $31,050
- − Mortgage interest
- −$17,359
- − Property taxes
- −$3,552
- − Insurance
- −$1,550
- − Repairs & maintenance
- −$2,484
- − Management
- −$2,484
- − Depreciation
- −$9,015
- Taxable loss
- −$5,394
- Est. tax savings @ 24.0%
- +$1,295
- After-tax cash flow
- $1,220/yr
For passive investors: Depreciation is non-cash, so a rental often shows a tax loss while cash-flowing — sheltering income. Rental losses are passive: they offset passive income freely, and up to $25,000/yr can offset ordinary (W-2) income if you actively participate and your MAGI is under $100k (phasing out to $0 by $150k); unused losses carry forward. On sale, claimed depreciation is recaptured at up to 25%, and gains may owe capital-gains tax (a 1031 exchange can defer both). Figures are a year-1 estimate at your 24.0% rate — not tax advice; consult a CPA.
Schools (NCES district)
- District
- New London School District
- NCES district ID
- 5510590
- Math proficiency
- 48% ▼ -3.00%
- Reading proficiency
- 37% ▼ -5.00%
- Median HH income
- $55,684
- Composite
- 37.17/100
- National rank
- #4480
- State rank
- #120 of 342 in WI
Livability — New London
- Score
- 71/100
- State rank
- #268
- US rank
- #6862
Category grades
Schools grade is shown separately in the Schools card above.
Census & demographics
- Census place
- New London, WI
- Population (ZIP)
- 14,310
Population outlook (Waupaca County) Hauer SSP2
- Today (2025)
- 51,499 people
- By 2030
- 50,628 · -1.7%
- By 2040
- 47,858 · -7.1%
- By 2050
- 44,228 · -14.1%
- By 2075
- 37,069 · -28.0%
- By 2100
- 29,186 · -43.3%
Race, ethnicity, and origin ACS 2023
- Neighborhood character
- Predominantly White (90%)
- Race & ethnicity
- White 90% Hispanic / Latino 5% Two or more races 4% Asian 1% Black 1%
- Common ancestry
- Romanian 7% Portuguese 5% Lithuanian 4%
- Foreign-born
- 1% · Canada
- Languages at home
- 95% English-only · Spanish 3%
Political lean MEDSL · Waupaca
- 2024 margin
- Solid R (+33.4) · D 32.8% · R 66.2% · Other 1.1%
- 2008→2024 swing
- -36.2pp toward R · 2008: 2.8pp · 2024: -33.4pp
- All cycles
- 2024: R+33.4 2020: R+31.8 2016: R+30.2 2012: R+9.4 2008: D+2.8
Not yet ingested
- Civics
- —
Market trends
- HPI YoY
- ▼ -102.06%
- Current HPI
- 214.5592
- Rent YoY
- —
- Metro
- —
- State GDP YoY
- ▲ 2.10%
- F500 in state
- 20
Industry mix (Fortune 500 HQ in WI)
| Industry | F500 HQs | Revenue |
|---|---|---|
| Industrial Machinery | 4 | $23B |
|
||
| Industrial Technology | 2 | $36B |
|
||
| Insurance | 1 | $36B |
|
||
| Professional Services | 1 | $19B |
|
||
| Utilities | 1 | $9B |
|
||
| Consumer Goods | 1 | $3B |
|
||
Price history
+146.1% since first listed4 events — show timeline
- 2026-06-01 Listed $319,900 RANW
- 2010-12-01 Sold (Public Records) $125,000 Public Records
- 2010-06-04 Sold (Public Records) $139,900 Public Records
- 2006-12-18 Sold (Public Records) $130,000 Public Records
Property tax history
+1.6%/yrLatest (2025): $3,552 · +9.2% YoY. Source: county tax records.
Cash-flow waterfall
monthlySold comps — $/sqft
last 12 mo · ≤1 miLoading sold comps…