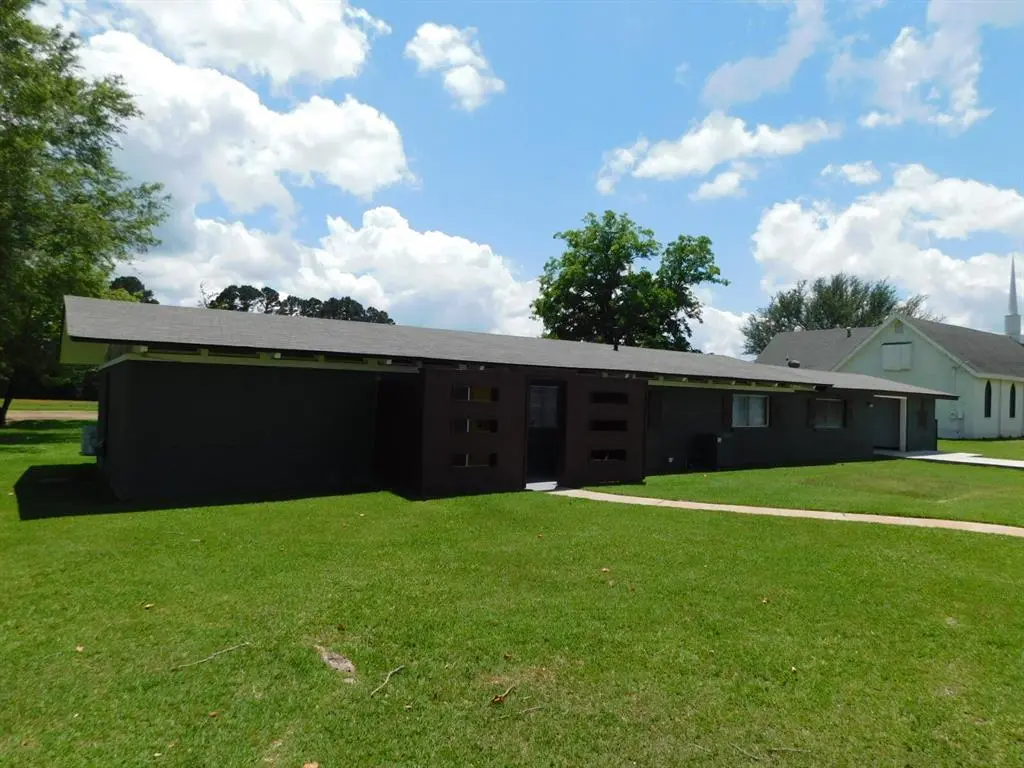
300 S Main St
Springhill, LA 71075
$139,900D
3 bd · 2.0 ba ·
1,489 sqft ·
Built 1950
· SingleFamily
· Active
· 24 DOM
Cashflow @ list (25.0% down · 7.5%)
Estimated rent
$1,134/mo
Mortgage (P&I)
−$734
Tax + insurance
−$233
HOA
−$0
Vac / Maint / Mgmt
−$238
Net cashflow
$-71/mo
Annual
$-856/yr
Cap rate
5.68%
Cash-on-cash
-2.19%
DSCR
0.90
1% rule
0.81%
Cash to close
$39,172
Investor read
- This is a 3-bed/2.0-bath single-family listed at $140k. Condition is rated good.
- At list price, monthly cash flow is $-71 ($-856/yr) — negative.
- To cash-flow at today's rent, offer at most $130k (7.4% below list).
- To meet the 1% rule (rent ≥ 1% of price), the offer needs to be $113k (19.0% below list).
- It's been on market 24 days — a 2% lower offer ($138k) is reasonable based on typical stale-listing flexibility.
- Recommended offer: $113k (19.0% below list) — sets the bar for 1% rule.
- In year one you build about $6k of equity ($967 loan paydown + $5k appreciation (3.6% local appreciation)).
- Location reads 65/100 on livability (#139 in LA) — a middle-class / working-renter tenant base. Strengths: cost of living A+, crime A-, health & safety A-; Watch: amenities F, commute F, employment F.
- Webster Parish (town): math 17% / reading 26% proficiency, ranked #67 of 98 in LA (top 68%) — low school quality limits family demand, transient renter base, plan for 1-2y turnover; 61% free/reduced lunch — lower-income household profile, screen leases tightly.
- Watch-outs: built in 1950 — expect roof / HVAC / electrical / plumbing capex.
- Market conditions: 44 active listings in the ZIP; 36 units permitted in Webster Parish in 2024 (0 in 5+ unit buildings).
- Webster County population projected at -21% by 2050 — secular population decline; favor cash flow + early exit over multi-decade hold.
- At projected returns (3.6% appreciation + 3.0% rent growth), your $39k cash investment doubles in ~7 years — after that, you're playing with house money.
- By year 6, paydown + projected appreciation supports a ~$32k cash-out refi (75% LTV) — recoverable capital for the next deal without selling this one.
Questions for listing agent
- What do current leases actually rent for vs. the listed asking? Can we see a recent rent roll and the last 12 months of T-12 income?
- Built in 1950 — when were the roof, HVAC, electrical panel, plumbing, and water heater last replaced?
- Is there a deadline driving the sale (1031 exchange, divorce, estate, relocation)? That informs how much negotiation room exists.
- The area grade is low — what's the realistic commute time and amenity access for the typical tenant pool here? Any planned neighborhood developments (good or bad) we should know about?
- What's the average days-on-market for RENTAL listings here right now (not sales)? A rising rental-DOM trend means longer vacancies and softer asking-rent achievability than the comps imply.
- What's the recent tenant-quality profile in this submarket — average credit score on applications, eviction rate, late-payment / NSF rate, and stable-employment percentage? A property-management company in the area should have these aggregated.
- How much new for-sale + rental construction is in the pipeline within 1–3 miles? Heavy new supply typically softens prices + rents 12–24 months out; constrained supply supports both.
CashFlowRE · CFR-CK24PC0SZPY194
· Data 2 days ago
cashflowre.app · 2026-05-29