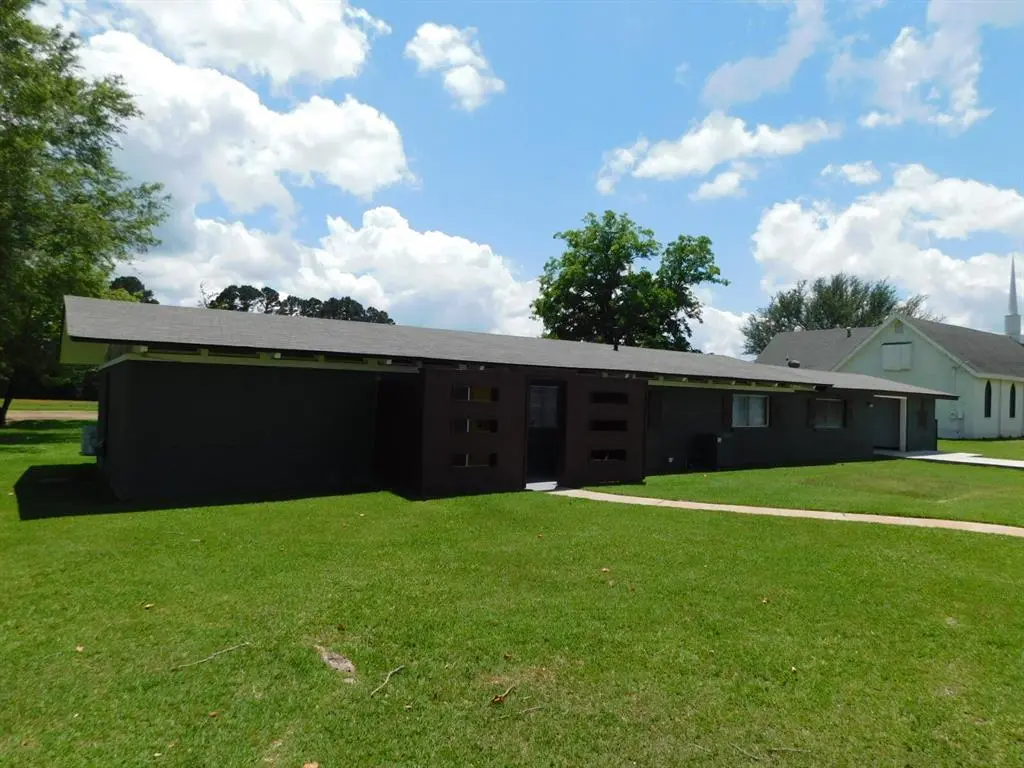
300 S Main St · Springhill, LA
Flood risk No data
- FEMA flood zone
- —
- Chance of flooding over 30 yrs
- —
- Est. flood insurance / yr
- —
Fire risk No data
- Est. fire insurance / yr
- —
Heat risk No data
- Hot days now (above threshold)
- —
- Hot days in 30 yrs
- —
Wind risk No data
- Chance of severe wind over 30 yrs
- —
Air-quality risk No data
- Unhealthy air days now
- —
- Unhealthy air days in 30 yrs
- —
Risk factors via First Street. Map © Google.
Why this score? — see what drove the D grade
The composite is a weighted blend of 9 inputs, each scored 0–100. Each bar is that input's sub-score; the figure is the points it added to the 100-point composite (weight × sub-score).
- Cash flow +10.5/30.0
- ARV discount +7.5/15.0
- Appreciation +6.8/10.0
- Condition / age +3.8/5.0
- Livability +3.2/5.0
- 1% rule +3.1/10.0
- DSCR +3.0/10.0
- Rent growth +2.5/5.0
- Schools +1.8/10.0
$139,900
🖨 Deal sheet 📄 Offer letter ✓ Due diligence
Listing remarks
THIS UNIQUE MID CENTURY MODERN 3 BEDROOM 2 BATHROOM HOME HAS APPROXIMATELY 1,489 SQUARE FEET OF LIVING AREA. THIS HOME FEATURES ARCHED CEILINGS WITH EXPOSED BEAMS THROUGHOUT, FRESH PAINT INSIDE & OUT, LOTS OF CLOSETS & STORAGE & GALLEY STYLE KITCHEN THAT FEATURES A COFFEE BAR. HOME ALSO HAS A 1 CFAR CARPORT WITH LARGE STORAGE-UTILITY ROOM. THIS HOME IS LOCATED WITHIN WALKING DISTANCE TO SHOPPING INCLUDING TRACTOR SUPPLY & WAL MART AS WELL AS THE URGENT CARE & CHAVO'S MEXICAN RESTAURANT. MUST SEE TO APPRECIATE!
Key facts
- Arched ceilings
- Fresh paint
- Lots of closets
Tags
Property features AI
Finance
- Financial info: Treat as clear loan type; No second mortgage
- HOA & community: No association
Exterior
- Parking: Attached carport (covered, 1 space); 1 carport space
- Utilities: City water; City sewer; Power and utilities available
- Home design: Single-family residence; One story; Residential property
- Construction: Brick construction; Composition roof; Built in 1950
- Exterior features: Less than 0.5-acre lot; All-weather road access; Asphalt on site
Interior
- Kitchen: Electric cooktop; Electric oven
- Bedrooms: 3 bedrooms (primary bedroom on level 1)
- Flooring: Carpet; Ceramic tile; Vinyl
- Bathrooms: 2 full bathrooms
- Heating & cooling: Central heating; Central air conditioning
- Interior features: Decorative lighting; Paneling; Other
- Laundry & utility: Utility room
Neighborhood map
What this means for you Summary
Snapshot
- This is a 3-bed/2.0-bath single-family listed at $140k. Condition is rated good.
Deal economics
- At list price, monthly cash flow is $-71 ($-856/yr) — negative.
- To cash-flow at today's rent, offer at most $130k (7.4% below list).
- To meet the 1% rule (rent ≥ 1% of price), the offer needs to be $113k (19.0% below list).
- Recommended offer: $113k (19.0% below list) — sets the bar for 1% rule.
Location & tenants
- Location reads 65/100 on livability (#139 in LA) — a middle-class / working-renter tenant base. Strengths: cost of living A+, crime A-, health & safety A-; Watch: amenities F, commute F, employment F.
- Webster Parish (town): math 17% / reading 26% proficiency, ranked #67 of 98 in LA (top 68%) — low school quality limits family demand, transient renter base, plan for 1-2y turnover; 61% free/reduced lunch — lower-income household profile, screen leases tightly.
- Market conditions: 44 active listings in the ZIP; 36 units permitted in Webster Parish in 2024 (0 in 5+ unit buildings).
Forward outlook
- In year one you build about $6k of equity ($967 loan paydown + $5k appreciation (3.6% local appreciation)).
- Webster County population projected at -21% by 2050 — secular population decline; favor cash flow + early exit over multi-decade hold.
- At projected returns (3.6% appreciation + 3.0% rent growth), your $39k cash investment doubles in ~7 years — after that, you're playing with house money.
- By year 6, paydown + projected appreciation supports a ~$32k cash-out refi (75% LTV) — recoverable capital for the next deal without selling this one.
Negotiation context
- It's been on market 24 days — a 2% lower offer ($138k) is reasonable based on typical stale-listing flexibility.
Risks & watch-outs
- Watch-outs: built in 1950 — expect roof / HVAC / electrical / plumbing capex.
Questions for the listing agent
- What do current leases actually rent for vs. the listed asking? Can we see a recent rent roll and the last 12 months of T-12 income?
- Built in 1950 — when were the roof, HVAC, electrical panel, plumbing, and water heater last replaced?
- Is there a deadline driving the sale (1031 exchange, divorce, estate, relocation)? That informs how much negotiation room exists.
- The area grade is low — what's the realistic commute time and amenity access for the typical tenant pool here? Any planned neighborhood developments (good or bad) we should know about?
- What's the average days-on-market for RENTAL listings here right now (not sales)? A rising rental-DOM trend means longer vacancies and softer asking-rent achievability than the comps imply.
- What's the recent tenant-quality profile in this submarket — average credit score on applications, eviction rate, late-payment / NSF rate, and stable-employment percentage? A property-management company in the area should have these aggregated.
- How much new for-sale + rental construction is in the pipeline within 1–3 miles? Heavy new supply typically softens prices + rents 12–24 months out; constrained supply supports both.
Investment metrics
- 1% rule
- 0.81% ✗
- Cap rate
- 5.68%
- Cash-on-cash
- -2.19%
- DSCR
- 0.90
- GRM
- 10.3
CMA / ARV
- ARV (on-the-fly)
- $77,428
- Comps found
- 12
Show comp detail 12 sales within ~0.75 mi
| Address | Dist | Beds/Ba | Sqft | Sold | Price | $/sf | Match |
|---|---|---|---|---|---|---|---|
| 201 NW 4th St | 0.47mi | 3/1.0 | 1,539 (+3%) | 6mo | $99,900 | $65 | 64 |
| 700 Reynolds St | 0.55mi | 2/2.0 (-1) | 1,520 (+2%) | 7mo | $149,500 | $98 | 60 |
| 702 S Park Dr | 0.51mi | 3/2.0 | 1,536 (+3%) | 13mo | $109,500 | $71 | 60 |
| 201 SE 3rd St | 0.24mi | 2/2.0 (-1) | 1,332 (-10%) | 11mo | $39,900 | $30 | 57 |
| 709 W Church St | 0.59mi | 2/1.0 (-1) | 1,397 (-6%) | 2mo | $40,000 | $29 | 51 |
| 405 SE 8th St | 0.56mi | 3/2.0 | 1,682 (+13%) | 4mo | $89,900 | $53 | 49 |
| 114 7th St | 0.34mi | 3/2.0 | 1,319 (-11%) | 21mo | $55,000 | $42 | 48 |
| 205 8th St NE | 0.66mi | 3/1.5 | 1,360 (-9%) | 6mo | $117,500 | $86 | 48 |
| 303 Center Park Dr | 0.22mi | 2/1.0 (-1) | 1,278 (-14%) | 16mo | $30,000 | $23 | 44 |
| 201 North St | 0.62mi | 3/2.0 | 1,297 (-13%) | 9mo | $53,000 | $41 | 42 |
| 201 2nd St NW | 0.42mi | 3/2.0 | 1,685 (+13%) | 21mo | $87,500 | $52 | 41 |
| 107 Willow St | 0.72mi | 2/2.0 (-1) | 1,620 (+9%) | 22mo | $40,000 | $25 | 29 |
Match score weights: distance 35% · size 25% · config 20% · recency 20%. Top-matched comps best support the ARV.
Projected returns pro-forma
3.57% appreciation · 3.0% rent growth · sell at horizon
- IRR
- 7.1%
- Equity multiple
- 1.42×
- Total profit
- $16,567
- Equity at exit
- $67,417
- IRR
- 9.6%
- Equity multiple
- 2.54×
- Total profit
- $60,262
- Equity at exit
- $107,551
Cash invested: $39,172 (down + closing). Projections, not guarantees.
Landlord ↔ Tenant lean methodology
- Overall (STATE)
- 90 Strongly Landlord-Friendly
- State Louisiana
- 90 Strongly Landlord-Friendly · R+12
- County
- — inherits STATE
- City
- — inherits STATE
ZIP-level market 71075
- Home prices YoY
- 4.1%
- Active inventory
- 44
- Price-to-rent
- 10.3×
Monthly cashflow live
- Estimated rent
- $1,134 medium interval (Pro) →
- Mortgage (P&I)
- −$734
- Tax est. 1.5%
- −$175 /mo · $2,098/yr
- Insurance
- −$58
- HOA
- −$0
- Vacancy / Maint / Mgmt
- −$238
- Net cashflow
- $-71
Break-even live
UW: 25.0% down · 7.5% · 30yr · 1.5% tax · 5.0% vac · 8.0% maint · 8.0% mgmt
Financing live
Cash to close
- Down payment
- $34,975
- Closing costs
- $4,197
- Reserves months
- —
- Total cash needed
- —
Loan-product check · same deal, 3 products live
Conventional
25% down · 7.5% · 30yr
- Down + closing
- —
- Monthly P&I
- —
- Monthly cashflow
- —
- DSCR
- —
- Eligible?
- —
Personal DTI + credit; lowest rate.
DSCR
20% down · 8.5% · 30yr
- Down + closing
- —
- Monthly P&I
- —
- Monthly cashflow
- —
- DSCR
- —
- Eligible?
- —
No personal income docs; deal must DSCR.
Hard money
10% down · 12.0% · 12mo
- Down + closing
- —
- Monthly P&I
- —
- Monthly cashflow
- —
- DSCR
- —
- Eligible?
- —
Short-term bridge; refi at stabilization.
Listing history 15 events
-
2026-06-18days on market $139,900 Active 24 DOM
-
2026-06-17days on market $139,900 Active 23 DOM
-
2026-06-16days on market $139,900 Active 22 DOM
-
2026-06-15days on market $139,900 Active 21 DOM
-
2026-06-14days on market $139,900 Active 19 DOM
-
2026-06-13days on market $139,900 Active 18 DOM
-
2026-06-10days on market $139,900 Active 16 DOM
-
2026-06-09days on market $139,900 Active 15 DOM
-
2026-06-08days on market $139,900 Active 14 DOM
-
2026-06-07days on market $139,900 Active 13 DOM
-
2026-06-02days on market $139,900 Active 8 DOM
-
2026-06-01days on market $139,900 Active 7 DOM
-
2026-05-31days on market $139,900 Active 6 DOM
-
2026-05-30days on market $139,900 Active 5 DOM
-
2026-05-25$139,900 Active
ⓘ Source: listings_history table (triggers on properties + properties_extension) + one-shot
backfill from property_details.listing_events for pre-trigger history.
Nearby sold comps map
Loading sold comps map…
Walkable amenities ~0.75 mi
Loading nearby amenities…
Taxation est. · year 1
- Rental income
- $13,602
- − Mortgage interest
- −$7,837
- − Property taxes
- −$2,098
- − Insurance
- −$700
- − Repairs & maintenance
- −$1,088
- − Management
- −$1,088
- − Depreciation
- −$4,070
- Taxable loss
- −$3,279
- Est. tax savings @ 24.0%
- +$787
- After-tax cash flow
- $-69/yr
For passive investors: Depreciation is non-cash, so a rental often shows a tax loss while cash-flowing — sheltering income. Rental losses are passive: they offset passive income freely, and up to $25,000/yr can offset ordinary (W-2) income if you actively participate and your MAGI is under $100k (phasing out to $0 by $150k); unused losses carry forward. On sale, claimed depreciation is recaptured at up to 25%, and gains may owe capital-gains tax (a 1031 exchange can defer both). Figures are a year-1 estimate at your 24.0% rate — not tax advice; consult a CPA.
Condition & rehab AI · 3 photos
This mid-century modern home is in good condition with fresh paint and a well-maintained exterior. It offers a good investment opportunity with potential for cosmetic updates to enhance its curb appeal and value.
Value-add opportunities
- Both Paint exterior — Enhances curb appeal and value
- Both Landscaping — Improves curb appeal and enhances property value
Renovation cost estimate screening
Value-add ROI direction
- Both Paint exterior — Enhances curb appeal and value ↑
- Both Landscaping — Improves curb appeal and enhances property value ↑
ⓘ Cost ranges are severity-bucket heuristics (US national rule-of-thumb). Get contractor quotes + a written scope before underwriting a rehab budget.
Schools (NCES district)
- District
- Webster Parish
- NCES district ID
- 2201890
- Math proficiency
- 17% ▼ -39.00%
- Reading proficiency
- 26% ▼ -38.00%
- Median HH income
- $33,011
- Composite
- 17.5/100
- National rank
- #9055
- State rank
- #67 of 98 in LA
Livability — Springhill
- Score
- 65/100
- State rank
- #139
- US rank
- #12517
Category grades
Schools grade is shown separately in the Schools card above.
Census & demographics
- Census place
- Springhill, LA
- Population (ZIP)
- 5,417
Population outlook (Webster County) Hauer SSP2
- Today (2025)
- 37,736 people
- By 2030
- 36,203 · -4.1%
- By 2040
- 32,988 · -12.6%
- By 2050
- 29,743 · -21.2%
- By 2075
- 22,346 · -40.8%
- By 2100
- 15,045 · -60.1%
Race, ethnicity, and origin ACS 2023
- Neighborhood character
- Diverse neighborhood (Simpson 0.56)
- Race & ethnicity
- White 56% Black 34% Hispanic / Latino 6% Two or more races 2% Native American 2%
- Hispanic origin (detail)
- Mexican 4%
- Common ancestry
- Iranian 4% Slovak 3% Lithuanian 2%
- Foreign-born
- 1% · Canada
- Languages at home
- 99% English-only · French/Haitian/Cajun 1% Spanish 1%
Political lean MEDSL · Webster
- 2024 margin
- Solid R (+36.5) · D 31.2% · R 67.7% · Other 1.1%
- 2008→2024 swing
- -10.2pp toward R · 2008: -26.3pp · 2024: -36.5pp
- All cycles
- 2024: R+36.5 2020: R+31.1 2016: R+29.1 2012: R+25.0 2008: R+26.3
Not yet ingested
- Civics
- —
Market trends
- HPI YoY
- ▲ 3.57%
- Current HPI
- 90.8938
- Rent YoY
- —
- Metro
- —
- State GDP YoY
- ▲ 3.29%
- F500 in state
- 10
Industry mix (Fortune 500 HQ in LA)
| Industry | F500 HQs | Revenue |
|---|---|---|
| Telecommunications | 2 | $23B |
|
||
| Utilities | 1 | $12B |
|
||
| Wholesale / Distribution | 1 | $5B |
|
||
| Advertising | 1 | $2B |
|
||
Price history
1 event — show timeline
- 2026-05-25 Listed $139,900 NTREIS
Cash-flow waterfall
monthlySold comps — $/sqft
last 12 mo · ≤1 miLoading sold comps…