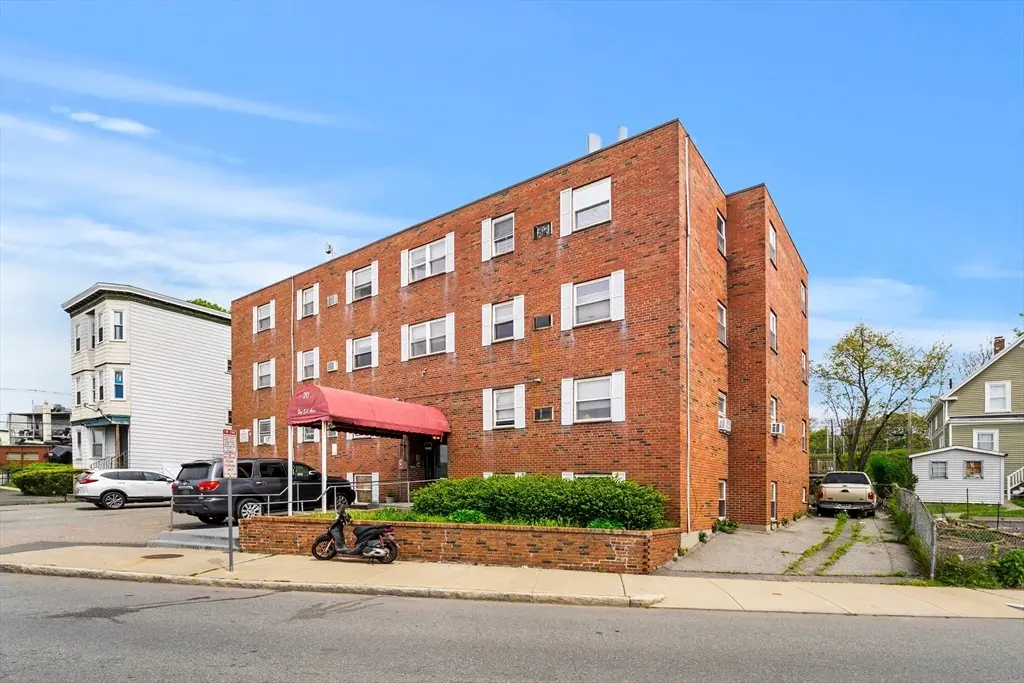
20 Hy-sil Ave
Chelsea, MA 02150
$4,440,000B-
352 bd · 256.0 ba ·
14,478 sqft ·
Built 1978
· MultiFamily
· Active
· 10 DOM
Cashflow @ list (25.0% down · 7.5%)
Estimated rent
$57,606/mo
Mortgage (P&I)
−$23,284
Tax + insurance
−$7,400
HOA
−$0
Vac / Maint / Mgmt
−$12,097
Net cashflow
$14,825/mo
Annual
$177,899/yr
Cap rate
10.30%
Cash-on-cash
14.31%
DSCR
1.64
1% rule
1.30%
Cash to close
$1,243,200
Investor read
- This is a 16 × 22-bed/16.0-bath units multifamily listed at $4.44M. Condition is rated good.
- At list price, monthly cash flow is $15k ($178k/yr) — positive. Per door: $927/mo.
- The deal already cash-flows at list — no discount required.
- Meets the 1% rule at list price ($58k rent vs $4.44M).
- Only 10 days on market — expect competitive offers; lowballing is unlikely to land.
- Local home prices are declining (-3.0%/yr); year-one equity from $31k of loan paydown is wiped out by about $133k of value loss. Plan a longer hold.
- Location reads 73/100 on livability (#103 in MA) — a middle-class / working-renter tenant base. Strengths: amenities A+, commute A+, health & safety A+; Watch: schools D+, crime F, cost of living F.
- Chelsea (suburban): math 12% / reading 24% proficiency, ranked #294 of 302 in MA (top 97%) — low school quality limits family demand, transient renter base, plan for 1-2y turnover; 80% free/reduced lunch — lower-income household profile, screen leases tightly.
- Market conditions: Rents rising (+3.0%/yr); 48 active listings in the ZIP; 2,207 units permitted in Suffolk County in 2024 (1,961 in 5+ unit buildings).
- Suffolk County population projected at +37% by 2050 — long-run rental-demand tailwind backs the buy-and-hold thesis.
- At projected returns (-3.0% appreciation + 3.0% rent growth), your $1.24M cash investment doubles in ~9 years — after that, you're playing with house money.
- Climate carrying-cost: major wind risk, 67% chance of damaging wind over 30y; extreme-heat days projected 7→15/yr by 2055 (HVAC capex compounding) — expect insurance premiums to compound above CPI over the hold.
- Cap rate 10.3% vs local median 3.6% in Chelsea — top-decile yield for the area; either an underpriced asset or a hidden risk that comps aren't pricing in. Stress-test before assuming the spread holds.
- At $57,606/mo this rent would consume 958% of the median local household income ($72k/yr) (locally 3332% of renters already pay >50% of income on rent) — very limited rent-growth headroom before tenants either downsize or default.
Questions for listing agent
- Can we see the unit-by-unit rent roll, current vacancy, and any below-market leases? What's the average tenancy length?
- What capital expenditures (roof, boiler, parking lot, exteriors) have been made in the last 5 years, and what's planned in the next 2?
- Built in 1978 — when were the roof, HVAC, electrical panel, plumbing, and water heater last replaced?
- Is there a deadline driving the sale (1031 exchange, divorce, estate, relocation)? That informs how much negotiation room exists.
- Schools are D-rated, which usually means shorter tenancies and higher turnover. Who's the typical renter profile here, and what's been the actual vacancy rate?
- Crime grade is F in this area — have there been break-ins, vandalism, or insurance claims at this property in the last 3 years? What carrier currently insures it and at what premium?
- What's the average days-on-market for RENTAL listings here right now (not sales)? A rising rental-DOM trend means longer vacancies and softer asking-rent achievability than the comps imply.
- What's the recent tenant-quality profile in this submarket — average credit score on applications, eviction rate, late-payment / NSF rate, and stable-employment percentage? A property-management company in the area should have these aggregated.
CashFlowRE · CFR-CKN8W7CTK45B5V
· Data 2 days ago
cashflowre.app · 2026-05-29