 16-Plex
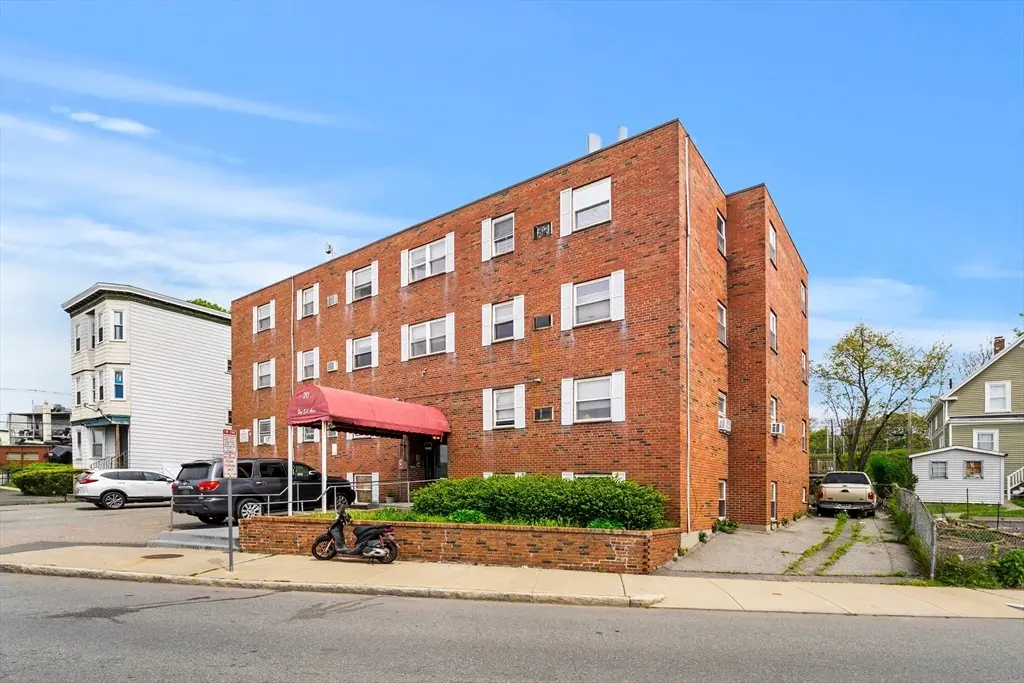
20 Hy-sil Ave · Chelsea, MA
Flood risk 1/10 · Minimal
- FEMA flood zone
- X (unshaded)
- Chance of flooding over 30 yrs
- 0.0%
- Est. flood insurance / yr
- $507 – $1,088
Fire risk 1/10 · Minimal
- Est. fire insurance / yr
- $915 – $1,699
Heat risk 6/10 · Moderate
- Hot days now (above 97°F)
- 7 days/yr
- Hot days in 30 yrs
- 15 days/yr
Wind risk 6/10 · Moderate
- Chance of severe wind over 30 yrs
- 67.0%
Air-quality risk 3/10 · Minor
- Unhealthy air days now
- 3 days/yr
- Unhealthy air days in 30 yrs
- 3 days/yr
Risk factors via First Street. Map © Google.
Why this score? — see what drove the B- grade
The composite is a weighted blend of 9 inputs, each scored 0–100. Each bar is that input's sub-score; the figure is the points it added to the 100-point composite (weight × sub-score).
- Cash flow +28.7/30.0
- DSCR +10.0/10.0
- 1% rule +8.0/10.0
- ARV discount +7.5/15.0
- Condition / age +4.0/5.0
- Livability +3.7/5.0
- Rent growth +3.3/5.0
- Schools +1.6/10.0
- Appreciation +0.0/10.0
$4,440,000
🖨 Deal sheet 📄 Offer letter ✓ Due diligence
Multi-family units
County records classify this as Multi-Family (2-4 Unit). Listing-text estimate: 16 units. estimate disagrees with records
Listing remarks
Northeast Private Client Group is pleased to present The Hy-Sil Apartments, a 16-unit apartment complex located at 7 & 20 Hy-Sil Avenue in Chelsea, Massachusetts. The Hy-Sil Apartments are comprised of (9) one-bedroom, (4) two-bedroom, and (3) three-bedroom units. Tenants are responsible for their own electric which is the source of heat & hot water. There is ample off-street parking and on-site coin-op laundry. The majority of units have been renovated, offering updated interiors that enhance rental upside and minimize near-term capital expenditure requirements. All interested and qualified parties will have the opportunity to walk the premises and obtain additional information
Key facts
- Off street parking
- Updated interiors
- 6,680 sq ft lot
Tags
Property features AI
Finance
- Other: Building total area: 14,478 square feet; Above-grade finished area: 7,798; Below-grade finished area: 6,680; Lot size approximately 0.15 acres; Listing status: Active
- HOA & community: Not a senior community
Exterior
- Parking: 16 open/off-street parking spaces
- Utilities: Public water; Public sewer; Electric service: 60 amps or less; Electric hookup for range and oven
- Home design: 5+ family property with units up/down; Three stories
- Construction: Brick construction; Concrete perimeter foundation; Built (year from public records)
- Exterior features: Paved driveway and off-street parking; Public road frontage; Rubber roof
Interior
- Bathrooms: 16 full bathrooms
- Interior features: Total of 52 rooms; 16 full bathrooms; Two separate leased units
Neighborhood map
What this means for you Summary
Snapshot
- This is a 16 × 22-bed/16.0-bath units multifamily listed at $4.44M. Condition is rated good.
Deal economics
- At list price, monthly cash flow is $15k ($178k/yr) — positive. Per door: $927/mo.
- The deal already cash-flows at list — no discount required.
- Meets the 1% rule at list price ($58k rent vs $4.44M).
- Cap rate 10.3% vs local median 3.6% in Chelsea — top-decile yield for the area; either an underpriced asset or a hidden risk that comps aren't pricing in. Stress-test before assuming the spread holds.
Location & tenants
- Location reads 73/100 on livability (#103 in MA) — a middle-class / working-renter tenant base. Strengths: amenities A+, commute A+, health & safety A+; Watch: schools D+, crime F, cost of living F.
- Chelsea (suburban): math 12% / reading 24% proficiency, ranked #294 of 302 in MA (top 97%) — low school quality limits family demand, transient renter base, plan for 1-2y turnover; 80% free/reduced lunch — lower-income household profile, screen leases tightly.
- Market conditions: Rents rising (+3.0%/yr); 48 active listings in the ZIP; 2,207 units permitted in Suffolk County in 2024 (1,961 in 5+ unit buildings).
- At $57,606/mo this rent would consume 958% of the median local household income ($72k/yr) (locally 3332% of renters already pay >50% of income on rent) — very limited rent-growth headroom before tenants either downsize or default.
Forward outlook
- Local home prices are declining (-3.0%/yr); year-one equity from $31k of loan paydown is wiped out by about $133k of value loss. Plan a longer hold.
- Suffolk County population projected at +37% by 2050 — long-run rental-demand tailwind backs the buy-and-hold thesis.
- At projected returns (-3.0% appreciation + 3.0% rent growth), your $1.24M cash investment doubles in ~9 years — after that, you're playing with house money.
Negotiation context
- Only 10 days on market — expect competitive offers; lowballing is unlikely to land.
Risks & watch-outs
- Climate carrying-cost: major wind risk, 67% chance of damaging wind over 30y; extreme-heat days projected 7→15/yr by 2055 (HVAC capex compounding) — expect insurance premiums to compound above CPI over the hold.
Questions for the listing agent
- Can we see the unit-by-unit rent roll, current vacancy, and any below-market leases? What's the average tenancy length?
- What capital expenditures (roof, boiler, parking lot, exteriors) have been made in the last 5 years, and what's planned in the next 2?
- Built in 1978 — when were the roof, HVAC, electrical panel, plumbing, and water heater last replaced?
- Is there a deadline driving the sale (1031 exchange, divorce, estate, relocation)? That informs how much negotiation room exists.
- Schools are D-rated, which usually means shorter tenancies and higher turnover. Who's the typical renter profile here, and what's been the actual vacancy rate?
- Crime grade is F in this area — have there been break-ins, vandalism, or insurance claims at this property in the last 3 years? What carrier currently insures it and at what premium?
- What's the average days-on-market for RENTAL listings here right now (not sales)? A rising rental-DOM trend means longer vacancies and softer asking-rent achievability than the comps imply.
- What's the recent tenant-quality profile in this submarket — average credit score on applications, eviction rate, late-payment / NSF rate, and stable-employment percentage? A property-management company in the area should have these aggregated.
- How much new apartment / multifamily construction is in the pipeline within 1–3 miles? Heavy new supply (>2% of stock underway) typically softens rents 12–24 months out; light construction supports rent growth.
Investment metrics
- 1% rule
- 1.30% ✓
- Cap rate
- 10.30%
- Cash-on-cash
- 14.31%
- DSCR
- 1.64
- GRM
- 6.4
CMA / ARV
No comps found within radius.
Projected returns pro-forma
-3.0% appreciation · 3.05% rent growth · sell at horizon
- IRR
- 4.7%
- Equity multiple
- 1.18×
- Total profit
- $228,504
- Equity at exit
- $662,018
- IRR
- 14.3%
- Equity multiple
- 2.15×
- Total profit
- $1,430,234
- Equity at exit
- $383,890
Cash invested: $1,243,200 (down + closing). Projections, not guarantees.
Landlord ↔ Tenant lean methodology
- Overall (STATE)
- 20 Strongly Tenant-Friendly
- State Massachusetts
- 20 Strongly Tenant-Friendly · D+15
- County
- — inherits STATE
- City
- — inherits STATE
ZIP-level market 02150
- Home prices YoY
- -20.3%
- Rents YoY
- 3.0%
- Active inventory
- 48
- Price-to-rent
- 102.8×
Monthly cashflow live
- Estimated rent
- $57,606 medium interval (Pro) →
- Mortgage (P&I)
- −$23,284
- Tax est. 1.5%
- −$5,550 /mo · $66,600/yr
- Insurance
- −$1,850
- HOA
- −$0
- Vacancy / Maint / Mgmt
- −$12,097
- Net cashflow
- $14,825
Break-even live
16-unit breakdown (identical units grouped — click to expand)
| Units | Beds | Baths | Est. rent |
|---|---|---|---|
| 16× units | 22 | 16 | $57,600 |
| #1 | 22 | 16 | $3,600 |
| #2 | 22 | 16 | $3,600 |
| #3 | 22 | 16 | $3,600 |
| #4 | 22 | 16 | $3,600 |
| #5 | 22 | 16 | $3,600 |
| #6 | 22 | 16 | $3,600 |
| #7 | 22 | 16 | $3,600 |
| #8 | 22 | 16 | $3,600 |
| #9 | 22 | 16 | $3,600 |
| #10 | 22 | 16 | $3,600 |
| #11 | 22 | 16 | $3,600 |
| #12 | 22 | 16 | $3,600 |
| #13 | 22 | 16 | $3,600 |
| #14 | 22 | 16 | $3,600 |
| #15 | 22 | 16 | $3,600 |
| #16 | 22 | 16 | $3,600 |
| Total (16 units) | $57,606 | ||
UW: 25.0% down · 7.5% · 30yr · 1.5% tax · 5.0% vac · 8.0% maint · 8.0% mgmt
Financing live
Cash to close
- Down payment
- $1,110,000
- Closing costs
- $133,200
- Reserves months
- —
- Total cash needed
- —
Loan-product check · same deal, 3 products live
Conventional
25% down · 7.5% · 30yr
- Down + closing
- —
- Monthly P&I
- —
- Monthly cashflow
- —
- DSCR
- —
- Eligible?
- —
Personal DTI + credit; lowest rate.
DSCR
20% down · 8.5% · 30yr
- Down + closing
- —
- Monthly P&I
- —
- Monthly cashflow
- —
- DSCR
- —
- Eligible?
- —
No personal income docs; deal must DSCR.
Hard money
10% down · 12.0% · 12mo
- Down + closing
- —
- Monthly P&I
- —
- Monthly cashflow
- —
- DSCR
- —
- Eligible?
- —
Short-term bridge; refi at stabilization.
Listing history 7 events
-
2026-06-18days on market $4,440,000 Active 10 DOM
-
2026-06-17days on market $4,440,000 Active 9 DOM
-
2026-06-16days on market $4,440,000 Active 8 DOM
-
2026-06-15days on market $4,440,000 Active 7 DOM
-
2026-06-13statusdays on market $4,440,000 Active 5 DOM
-
2026-06-08remarks 691-char remark
-
2026-06-08$4,440,000 New 1 DOM
ⓘ Source: listings_history table (triggers on properties + properties_extension) + one-shot
backfill from property_details.listing_events for pre-trigger history.
Climate risk First Street
- Flood 1/10 Low FEMA zone X (unshaded) · 0% chance over 30 yrs
- Wildfire 1/10 Low
- Heat 6/10 Major 7 d/yr ≥97°F today · 15 d/yr by 30 yrs out
- Wind 6/10 Major 67% chance of damaging wind over 30 yrs
- Air quality 3/10 Moderate 3 unhealthy d/yr today · 3 by 30 yrs out
Nearby sold comps map
Loading sold comps map…
Walkable amenities ~0.75 mi
Loading nearby amenities…
Taxation est. · year 1
- Rental income
- $691,272
- − Mortgage interest
- −$248,709
- − Property taxes
- −$66,600
- − Insurance
- −$22,200
- − Repairs & maintenance
- −$55,302
- − Management
- −$55,302
- − Depreciation
- −$129,164
- Taxable income
- $113,996
- Est. tax owed @ 24.0%
- −$27,359
- After-tax cash flow
- $150,540/yr
For passive investors: Depreciation is non-cash, so a rental often shows a tax loss while cash-flowing — sheltering income. Rental losses are passive: they offset passive income freely, and up to $25,000/yr can offset ordinary (W-2) income if you actively participate and your MAGI is under $100k (phasing out to $0 by $150k); unused losses carry forward. On sale, claimed depreciation is recaptured at up to 25%, and gains may owe capital-gains tax (a 1031 exchange can defer both). Figures are a year-1 estimate at your 24.0% rate — not tax advice; consult a CPA.
Condition & rehab AI · 13 photos
The Hy-Sil Apartments present as a well-maintained, move-in-ready property with good condition and minimal repairs needed. Painting and landscaping improvements can further enhance its value.
Value-add opportunities
- Both Painting exterior and interior walls — Fresh paint enhances curb appeal and interior aesthetics, attracting more tenants and buyers.
- Both Landscaping improvements — Enhanced landscaping can increase curb appeal and property value.
Renovation cost estimate screening
Value-add ROI direction
- Both Painting exterior and interior walls — Fresh paint enhances curb appeal and interior aesthetics, attracting more tenants and buyers. ↑
- Both Landscaping improvements — Enhanced landscaping can increase curb appeal and property value. ↑
ⓘ Cost ranges are severity-bucket heuristics (US national rule-of-thumb). Get contractor quotes + a written scope before underwriting a rehab budget.
Schools (NCES district)
- District
- Chelsea
- NCES district ID
- 2503540
- Math proficiency
- 12% ▼ -15.00%
- Reading proficiency
- 24% ▼ -8.00%
- Median HH income
- $46,339
- Composite
- 15.86/100
- National rank
- #9259
- State rank
- #294 of 302 in MA
Livability — Chelsea
- Score
- 73/100
- State rank
- #103
- US rank
- #5375
Category grades
Schools grade is shown separately in the Schools card above.
Census & demographics
- Census place
- Chelsea, MA
- County
- Suffolk County · 777,335 people
- City population
- 39,908
- Metro
- Boston-Cambridge-Newton, MA-NH
- Population (ZIP)
- 39,908
- Household income
- $72,179
- Rent vs Own
- Severe rent burden
- 3332.0
Population outlook (Suffolk County) Hauer SSP2
- Today (2025)
- 915,464 people
- By 2030
- 983,798 · +7.5%
- By 2040
- 1,119,602 · +22.3%
- By 2050
- 1,255,187 · +37.1%
- By 2075
- 1,534,434 · +67.6%
- By 2100
- 1,748,505 · +91.0%
Race, ethnicity, and origin ACS 2023
- Neighborhood character
- Predominantly Hispanic (65%)
- Race & ethnicity
- Hispanic / Latino 65% Two or more races 51% White 20% Black 6% Asian 3%
- Hispanic origin (detail)
- Puerto Rican 9% Dominican 4%
- Common ancestry
- Estonian 2% Romanian 1% Lithuanian 1%
- Foreign-born
- 45% · Canada, Jamaica, China
- Languages at home
- 30% English-only · Spanish 59% Other Indo-European 3% Arabic 2%
Political lean MEDSL · Suffolk
- 2024 margin
- Solid D (+52.5) · D 74.8% · R 22.4% · Other 2.8%
- 2008→2024 swing
- -3.2pp toward R · 2008: 55.7pp · 2024: 52.5pp
- All cycles
- 2024: D+52.5 2020: D+63.2 2016: D+63.0 2012: D+56.7 2008: D+55.7
Not yet ingested
- Civics
- —
Market trends
- HPI YoY
- ▼ -101.21%
- Current HPI
- 397.5973
- Rent YoY
- ▲ 3.05%
- Metro
- Boston-Cambridge-Newton, MA-NH
- State GDP YoY
- ▲ 2.28%
- F500 in state
- 38
Industry mix (Fortune 500 HQ in MA)
| Industry | F500 HQs | Revenue |
|---|---|---|
| Technology | 3 | $17B |
|
||
| Insurance | 2 | $84B |
|
||
| Retail | 2 | $76B |
|
||
| Life Sciences | 1 | $43B |
|
||
| Energy Technology | 1 | $31B |
|
||
| Aerospace / Defense | 1 | $18B |
|
||
Price history
1 event — show timeline
- 2026-06-08 Listed $4,440,000 MLS PIN
Cash-flow waterfall
monthlySold comps — $/sqft
last 12 mo · ≤1 miLoading sold comps…