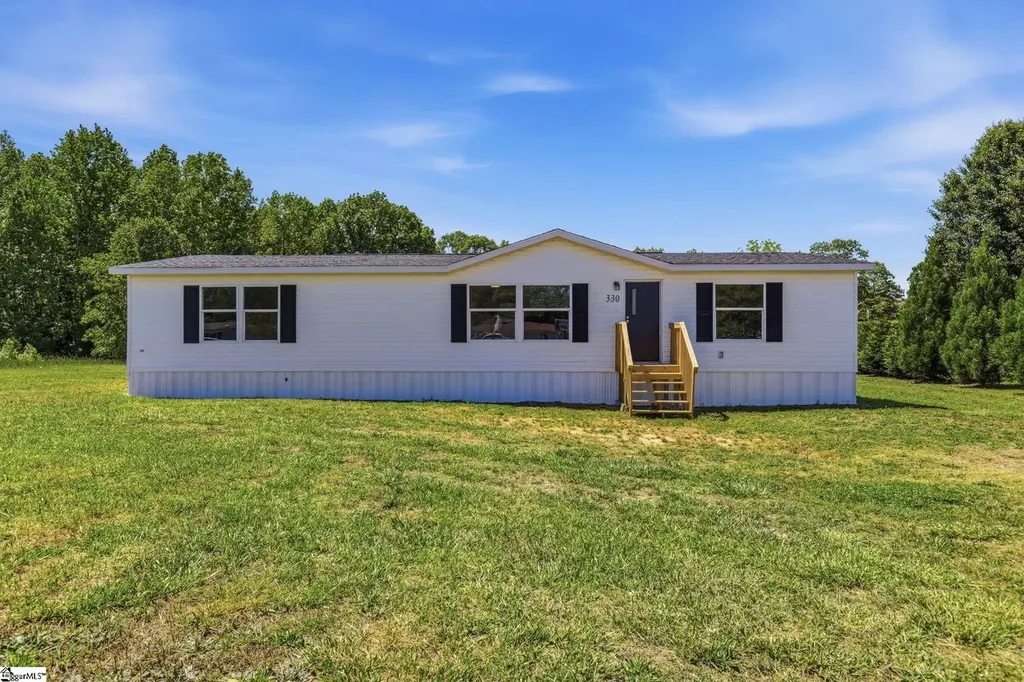
330 Tyger Fox Dr
Lyman, SC 29365
$219,900D
3 bd · 2.0 ba ·
1,568 sqft ·
Built 2012
· Manufactured
· Active
· 36 DOM
Cashflow @ list (25.0% down · 7.5%)
Estimated rent
$1,953/mo
Mortgage (P&I)
−$1,153
Tax + insurance
−$366
HOA
−$0
Vac / Maint / Mgmt
−$410
Net cashflow
$23/mo
Annual
$276/yr
Cap rate
6.42%
Cash-on-cash
0.45%
DSCR
1.02
1% rule
0.89%
Cash to close
$61,572
Investor read
- This is a 3-bed/2.0-bath manufactured listed at $220k.
- At list price, monthly cash flow is $23 ($276/yr) — positive.
- The deal already cash-flows at list — no discount required.
- To meet the 1% rule (rent ≥ 1% of price), the offer needs to be $195k (11.2% below list).
- It's been on market 36 days — a 3% lower offer ($213k) is reasonable based on typical stale-listing flexibility.
- Recommended offer: $195k (11.2% below list) — sets the bar for 1% rule.
- Local home prices are declining (-3.0%/yr); year-one equity from $2k of loan paydown is wiped out by about $7k of value loss. Plan a longer hold.
- Location reads 68/100 on livability (#83 in SC) — a middle-class / working-renter tenant base. Strengths: cost of living A+, housing A+, crime A-; Watch: amenities F, commute F, health & safety F.
- Spartanburg 05 (suburban): math 45% / reading 51% proficiency, ranked #13 of 80 in SC (top 16%) — families likely to look elsewhere, expect single-tenant / working-renter base with shorter leases.
- Zoned schools: Lyman Elementary (math 51% / reading 52%, grade C-, #155 of 597 statewide, top 26%, 835 students, 70% FRL); D. R. Hill Middle (math 28% / reading 38%, grade F, #116 of 229 statewide, top 51%, 702 students, 80% FRL); James F. Byrnes High (math 31% / reading 75%, grade C-, #140 of 196 statewide, top 72%, 2,217 students, 56% FRL) — zoned schools average 69% FRL vs 39% district-wide (29 pts higher); higher-poverty schools than district average — tighter screening recommended.
- Market conditions: 222 active listings in the ZIP; 2 comparable units currently listed for rent nearby; solid renter incomes; 3,129 units permitted in Spartanburg County in 2024 (40 in 5+ unit buildings).
- Spartanburg County population projected at +18% by 2050 — long-run rental-demand tailwind backs the buy-and-hold thesis.
- Climate carrying-cost: extreme-heat days projected 7→17/yr by 2055 (HVAC capex compounding) — expect insurance premiums to compound above CPI over the hold.
- Cap rate 6.4% vs local median 3.6% in Lyman — top-decile yield for the area; either an underpriced asset or a hidden risk that comps aren't pricing in. Stress-test before assuming the spread holds.
- This rent runs 30% of the median local income ($77k/yr) — at the standard rent-burdened threshold; future hikes will face affordability resistance.
Questions for listing agent
- It's been on market 36 days. Have you received any prior offers? Is the seller open to a 11% concession, seller financing, or rate buy-down credit?
- Is there a deadline driving the sale (1031 exchange, divorce, estate, relocation)? That informs how much negotiation room exists.
- Schools are D-rated, which usually means shorter tenancies and higher turnover. Who's the typical renter profile here, and what's been the actual vacancy rate?
- The area grade is low — what's the realistic commute time and amenity access for the typical tenant pool here? Any planned neighborhood developments (good or bad) we should know about?
- What's the average days-on-market for RENTAL listings here right now (not sales)? A rising rental-DOM trend means longer vacancies and softer asking-rent achievability than the comps imply.
- What's the recent tenant-quality profile in this submarket — average credit score on applications, eviction rate, late-payment / NSF rate, and stable-employment percentage? A property-management company in the area should have these aggregated.
- How much new for-sale + rental construction is in the pipeline within 1–3 miles? Heavy new supply typically softens prices + rents 12–24 months out; constrained supply supports both.
CashFlowRE · CFR-CKV49V437043QJ
· Data 14 h ago
cashflowre.app · 2026-05-29