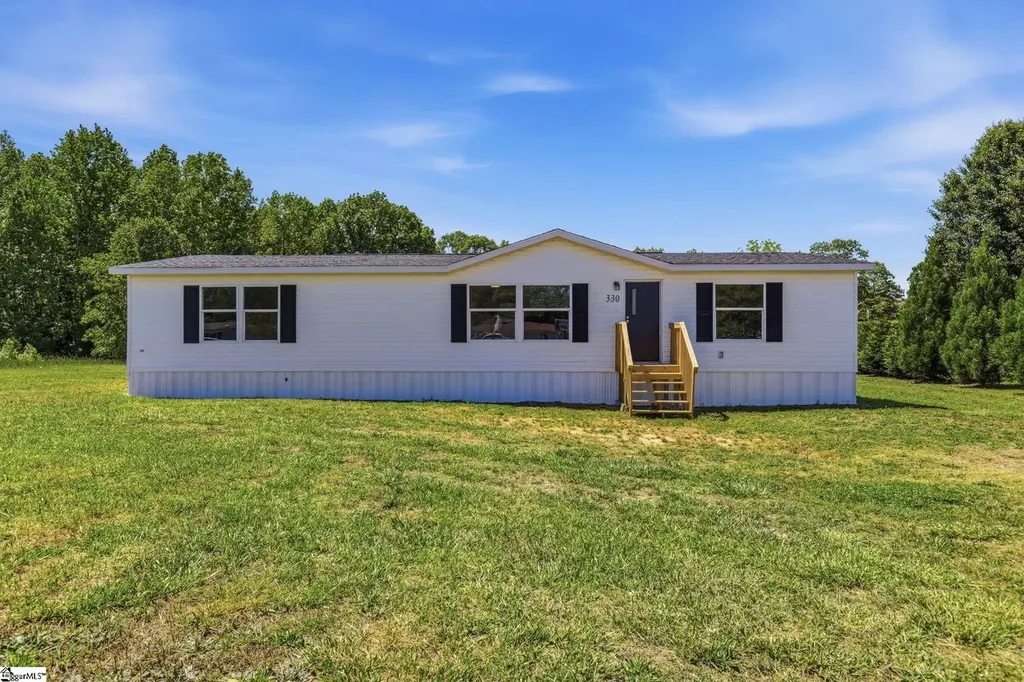
330 Tyger Fox Dr · Lyman, SC
Flood risk 1/10 · Minimal
- FEMA flood zone
- X (unshaded)
- Chance of flooding over 30 yrs
- 0.0%
- Est. flood insurance / yr
- $507 – $1,088
Fire risk 4/10 · Minor
- Est. fire insurance / yr
- $783 – $1,453
Heat risk 6/10 · Moderate
- Hot days now (above 104°F)
- 7 days/yr
- Hot days in 30 yrs
- 17 days/yr
Wind risk 2/10 · Minimal
- Chance of severe wind over 30 yrs
- 0.0%
Air-quality risk 4/10 · Minor
- Unhealthy air days now
- 4 days/yr
- Unhealthy air days in 30 yrs
- 5 days/yr
Risk factors via First Street. Map © Google.
Why this score? — see what drove the D grade
The composite is a weighted blend of 9 inputs, each scored 0–100. Each bar is that input's sub-score; the figure is the points it added to the 100-point composite (weight × sub-score).
- Cash flow +13.9/30.0
- ARV discount +7.5/15.0
- DSCR +4.2/10.0
- Schools +4.1/10.0
- 1% rule +3.9/10.0
- Livability +3.4/5.0
- Rent growth +2.5/5.0
- Condition / age +2.5/5.0
- Appreciation +0.0/10.0
$219,900
🖨 Deal sheet (PDF) 📄 Offer letter ✓ Due diligence
Listing remarks
Completely renovated and move-in ready! This 3 bedroom, 2 bathroom de-titled double wide sits on a spacious . 59-acre lot and has been updated from top to bottom. Inside, you’ll find fresh paint throughout, new durable LVP flooring, all new light fixtures, doors, hardware, fixtures, and a new HVAC system, creating a modern and inviting feel. The beautifully updated kitchen features brand-new cabinets, quartz countertops, and all new appliances. Both bathrooms have been refreshed with new vanities, and the primary bath includes a new tub/shower combo. Outside, enjoy new front and rear decks, new underpinning, and a 160-square-foot storage building offering plenty of extra space. With a
Key facts
- Renovated
- New flooring
- Spacious lot
Tags
Property features AI
Finance
- Other: Approximate finished/heated area listed as about 1,500 sq ft; No finished or unfinished below-grade space
- HOA & community: No HOA fees or community amenities listed
Exterior
- Parking: Driveway parking with gravel surface; No garage
- Utilities: Public water; Public sewer; Electric water heater; No garbage pickup listed
- Home design: Single-story residential home; Approximately 11–20 years old
- Construction: Vinyl siding exterior; Architectural roof; Crawl space foundation
- Exterior features: Deck; Tilt-out windows; Vinyl/aluminum trim; Thermal windows; Level lot; Underground utilities; Outbuilding for storage
Interior
- Kitchen: Kitchen about 13 x 13; Dishwasher; Stand-alone smooth-top range; Built-in microwave
- Bedrooms: Three bedrooms on the main level; Primary bedroom with full bath, tub/shower, and walk-in closet; Primary bedroom about 18 x 13; Second bedroom about 13 x 9; Third bedroom about 13 x 9
- Flooring: Luxury vinyl tile/plank flooring
- Bathrooms: Two full bathrooms (both on the main level)
- Heating & cooling: Heat pump for heating and cooling
- Interior features: Cable available; Smoke detector; Walk-in closet; Split floor plan; Quartz countertops; Pantry closet
- Laundry & utility: Laundry on the first floor in/near the kitchen; Washer connection; Electric dryer hookup
Neighborhood map
What this means for you Summary
Snapshot
- This is a 3-bed/2.0-bath manufactured listed at $220k.
Deal economics
- At list price, monthly cash flow is $23 ($276/yr) — positive.
- The deal already cash-flows at list — no discount required.
- To meet the 1% rule (rent ≥ 1% of price), the offer needs to be $195k (11.2% below list).
- Recommended offer: $195k (11.2% below list) — sets the bar for 1% rule.
- Cap rate 6.4% vs local median 3.6% in Lyman — top-decile yield for the area; either an underpriced asset or a hidden risk that comps aren't pricing in. Stress-test before assuming the spread holds.
Location & tenants
- Location reads 68/100 on livability (#83 in SC) — a middle-class / working-renter tenant base. Strengths: cost of living A+, housing A+, crime A-; Watch: amenities F, commute F, health & safety F.
- Spartanburg 05 (suburban): math 45% / reading 51% proficiency, ranked #13 of 80 in SC (top 16%) — families likely to look elsewhere, expect single-tenant / working-renter base with shorter leases.
- Zoned schools: Lyman Elementary (math 51% / reading 52%, grade C-, #155 of 597 statewide, top 26%, 835 students, 70% FRL); D. R. Hill Middle (math 28% / reading 38%, grade F, #116 of 229 statewide, top 51%, 702 students, 80% FRL); James F. Byrnes High (math 31% / reading 75%, grade C-, #140 of 196 statewide, top 72%, 2,217 students, 56% FRL) — zoned schools average 69% FRL vs 39% district-wide (29 pts higher); higher-poverty schools than district average — tighter screening recommended.
- Market conditions: 222 active listings in the ZIP; 2 comparable units currently listed for rent nearby; solid renter incomes; 3,129 units permitted in Spartanburg County in 2024 (40 in 5+ unit buildings).
- This rent runs 30% of the median local income ($77k/yr) — at the standard rent-burdened threshold; future hikes will face affordability resistance.
Forward outlook
- Local home prices are declining (-3.0%/yr); year-one equity from $2k of loan paydown is wiped out by about $7k of value loss. Plan a longer hold.
- Spartanburg County population projected at +18% by 2050 — long-run rental-demand tailwind backs the buy-and-hold thesis.
Negotiation context
- It's been on market 36 days — a 3% lower offer ($213k) is reasonable based on typical stale-listing flexibility.
Risks & watch-outs
- Climate carrying-cost: extreme-heat days projected 7→17/yr by 2055 (HVAC capex compounding) — expect insurance premiums to compound above CPI over the hold.
Questions for the listing agent
- It's been on market 36 days. Have you received any prior offers? Is the seller open to a 11% concession, seller financing, or rate buy-down credit?
- Is there a deadline driving the sale (1031 exchange, divorce, estate, relocation)? That informs how much negotiation room exists.
- Schools are D-rated, which usually means shorter tenancies and higher turnover. Who's the typical renter profile here, and what's been the actual vacancy rate?
- The area grade is low — what's the realistic commute time and amenity access for the typical tenant pool here? Any planned neighborhood developments (good or bad) we should know about?
- What's the average days-on-market for RENTAL listings here right now (not sales)? A rising rental-DOM trend means longer vacancies and softer asking-rent achievability than the comps imply.
- What's the recent tenant-quality profile in this submarket — average credit score on applications, eviction rate, late-payment / NSF rate, and stable-employment percentage? A property-management company in the area should have these aggregated.
- How much new for-sale + rental construction is in the pipeline within 1–3 miles? Heavy new supply typically softens prices + rents 12–24 months out; constrained supply supports both.
Investment metrics
- 1% rule
- 0.89% ✗
- Cap rate
- 6.42%
- Cash-on-cash
- 0.45%
- DSCR
- 1.02
- GRM
- 9.4
CMA / ARV
No comps found within radius.
Projected returns pro-forma
-3.0% appreciation · 3.0% rent growth · sell at horizon
- IRR
- -15.6%
- Equity multiple
- 0.45×
- Total profit
- $-34,136
- Equity at exit
- $32,788
- IRR
- -7.1%
- Equity multiple
- 0.55×
- Total profit
- $-27,716
- Equity at exit
- $19,013
Cash invested: $61,572 (down + closing). Projections, not guarantees.
Landlord ↔ Tenant lean methodology
- Overall (STATE)
- 90 Strongly Landlord-Friendly
- State South Carolina
- 90 Strongly Landlord-Friendly · R+6
- County
- — inherits STATE
- City
- — inherits STATE
ZIP-level market 29365
- Home prices YoY
- -18.1%
- Active inventory
- 222
- Price-to-rent
- 9.4×
Monthly cashflow live
- Estimated rent
- $1,953 medium interval (Pro) →
- Mortgage (P&I)
- −$1,153
- Tax est. 1.5%
- −$275 /mo · $3,298/yr
- Insurance
- −$92
- HOA
- −$0
- Vacancy / Maint / Mgmt
- −$410
- Net cashflow
- $23
Break-even live
Sensitivity live
| Price | -10% $175 | -5% $99 | +0% $23 | +5% $-53 | +10% $-129 |
|---|---|---|---|---|---|
| Rent | -10% $-131 | -5% $-54 | +0% $23 | +5% $100 | +10% $177 |
| Rate | -1.0pp $134 | -0.5pp $79 | base $23 | +0.5pp $-34 | +1.0pp $-92 |
UW: 25.0% down · 7.5% · 30yr · 1.5% tax · 5.0% vac · 8.0% maint · 8.0% mgmt
Financing live
Cash to close
- Down payment
- $54,975
- Closing costs
- $6,597
- Reserves months
- —
- Total cash needed
- —
Loan-product check · same deal, 3 products live
Conventional
25% down · 7.5% · 30yr
- Down + closing
- —
- Monthly P&I
- —
- Monthly cashflow
- —
- DSCR
- —
- Eligible?
- —
Personal DTI + credit; lowest rate.
DSCR
20% down · 8.5% · 30yr
- Down + closing
- —
- Monthly P&I
- —
- Monthly cashflow
- —
- DSCR
- —
- Eligible?
- —
No personal income docs; deal must DSCR.
Hard money
10% down · 12.0% · 12mo
- Down + closing
- —
- Monthly P&I
- —
- Monthly cashflow
- —
- DSCR
- —
- Eligible?
- —
Short-term bridge; refi at stabilization.
Rent comps 2 comps
| Address | Beds | Baths | Sqft | Rent | $/sqft | DOM | Units | Dist |
|---|---|---|---|---|---|---|---|---|
| 1614 Yarrow Ln Lyman, SC | 4.0 | 2.5 | 2175 | $2,165 | $1.00 | 15d | 1 | 1.05mi |
| 126 Arrow Ct Unit 126 Greer, SC | 3.0 | 2.5 | 1601 | $1,875 | $1.17 | 23d | 1 | 1.46mi |
Listing history 16 events
-
2026-06-22days on market $219,900 Active 36 DOM
-
2026-06-18days on market $219,900 Active 33 DOM
-
2026-06-17days on market $219,900 Active 32 DOM
-
2026-06-16days on market $219,900 Active 31 DOM
-
2026-06-15days on market $219,900 Active 30 DOM
-
2026-06-14days on market $219,900 Active 28 DOM
-
2026-06-13days on market $219,900 Active 27 DOM
-
2026-06-10pricedays on market $219,900 Active 25 DOM
-
2026-06-09days on market $225,000 Active 24 DOM
-
2026-06-08days on market $225,000 Active 23 DOM
-
2026-06-07days on market $225,000 Active 22 DOM
-
2026-06-02days on market $225,000 Active 17 DOM
-
2026-06-01days on market $225,000 Active 16 DOM
-
2026-05-31days on market $225,000 Active 15 DOM
-
2026-05-30days on market $225,000 Active 14 DOM
-
2026-05-16$225,000 Active
ⓘ Source: listings_history table (triggers on properties + properties_extension) + one-shot
backfill from property_details.listing_events for pre-trigger history.
Climate risk First Street
- Flood 1/10 Low FEMA zone X (unshaded) · 0% chance over 30 yrs
- Wildfire 4/10 Moderate
- Heat 6/10 Major 7 d/yr ≥104°F today · 17 d/yr by 30 yrs out
- Wind 2/10 Low 0% chance of damaging wind over 30 yrs
- Air quality 4/10 Moderate 4 unhealthy d/yr today · 5 by 30 yrs out
Nearby sold comps map
Loading sold comps map…
Walkable amenities ~0.75 mi
Loading nearby amenities…
Taxation est. · year 1
- Rental income
- $23,434
- − Mortgage interest
- −$12,318
- − Property taxes
- −$3,298
- − Insurance
- −$1,100
- − Repairs & maintenance
- −$1,875
- − Management
- −$1,875
- − Depreciation
- −$6,397
- Taxable loss
- −$3,429
- Est. tax savings @ 24.0%
- +$823
- After-tax cash flow
- $1,099/yr
For passive investors: Depreciation is non-cash, so a rental often shows a tax loss while cash-flowing — sheltering income. Rental losses are passive: they offset passive income freely, and up to $25,000/yr can offset ordinary (W-2) income if you actively participate and your MAGI is under $100k (phasing out to $0 by $150k); unused losses carry forward. On sale, claimed depreciation is recaptured at up to 25%, and gains may owe capital-gains tax (a 1031 exchange can defer both). Figures are a year-1 estimate at your 24.0% rate — not tax advice; consult a CPA.
Schools (NCES district)
- District
- Spartanburg 05
- NCES district ID
- 4503600
- Math proficiency
- 45% ▼ -11.00%
- Reading proficiency
- 51% ▬ 0.00%
- Median HH income
- $52,127
- Composite
- 41.31/100
- National rank
- #3512
- State rank
- #13 of 80 in SC
Livability — Lyman
- Score
- 68/100
- State rank
- #83
- US rank
- #9705
Category grades
Schools grade is shown separately in the Schools card above.
Census & demographics
- County
- Spartanburg County · 258,607 people
- City population
- 14,068
- Metro
- Spartanburg, SC
- Population (ZIP)
- 14,068
- Household income
- $76,966
- Rent vs Own
- Severe rent burden
- 234.0
Population outlook (Spartanburg County) Hauer SSP2
- Today (2025)
- 325,495 people
- By 2030
- 338,800 · +4.1%
- By 2040
- 363,471 · +11.7%
- By 2050
- 384,156 · +18.0%
- By 2075
- 430,137 · +32.1%
- By 2100
- 442,733 · +36.0%
Race, ethnicity, and origin ACS 2023
- Neighborhood character
- Predominantly White (74%)
- Race & ethnicity
- White 74% Black 11% Two or more races 10% Hispanic / Latino 9% Asian 2%
- Hispanic origin (detail)
- Mexican 6% Puerto Rican 2%
- Common ancestry
- Scotch-Irish 5% Serbian 4% Slovak 2%
- Foreign-born
- 9% · Canada, Philippines, Jamaica
- Languages at home
- 83% English-only · Russian/Polish/Slavic 8% Spanish 7% Other Asian/Pacific 1%
Political lean MEDSL · Spartanburg
- 2024 margin
- Solid R (+33.6) · D 32.6% · R 66.2% · Other 1.2%
- 2008→2024 swing
- -12.0pp toward R · 2008: -21.6pp · 2024: -33.6pp
- All cycles
- 2024: R+33.6 2020: R+27.3 2016: R+30.0 2012: R+23.1 2008: R+21.6
Not yet ingested
- Civics
- —
Market trends
- HPI YoY
- ▼ -56.35%
- Current HPI
- 254.6167
- Rent YoY
- —
- Metro
- Spartanburg, SC
- State GDP YoY
- ▲ 4.51%
- F500 in state
- 2
Industry mix (Fortune 500 HQ in SC)
| Industry | F500 HQs | Revenue |
|---|---|---|
| Packaging | 1 | $7B |
|
||
Price history
1 event — show timeline
- 2026-05-16 Listed $225,000 Greater Greenville MLS
Cash-flow waterfall
monthlySold comps — $/sqft
last 12 mo · ≤1 miLoading sold comps…