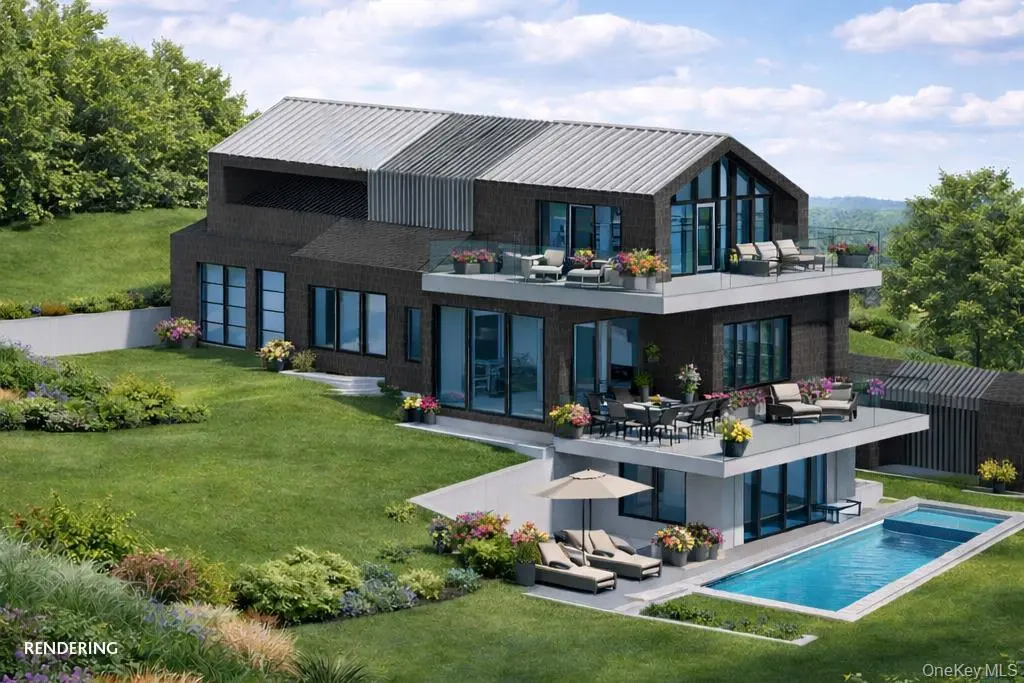
46 Three Mile Harbor Hog Creek Hwy
Northwest Harbor, NY 11937
$3,995,000D-
5 bd · 5.5 ba ·
0 sqft ·
Built 2026
· Land
· Active
· 91 DOM
Cashflow @ list (25.0% down · 7.5%)
Estimated rent
$24,746/mo
Mortgage (P&I)
−$20,950
Tax + insurance
−$6,658
HOA
−$0
Vac / Maint / Mgmt
−$5,197
Net cashflow
$-8,059/mo
Annual
$-96,709/yr
Cap rate
3.87%
Cash-on-cash
-8.65%
DSCR
0.62
1% rule
0.62%
Cash to close
$1,118,600
Investor read
- This is a 5-bed/5.5-bath land listed at $4.00M.
- At list price, monthly cash flow is $-8k ($-97k/yr) — negative.
- To cash-flow at today's rent, offer at most $2.83M (29.2% below list).
- To meet the 1% rule (rent ≥ 1% of price), the offer needs to be $2.47M (38.1% below list).
- It's been on market 91 days — a 9% lower offer ($3.64M) is reasonable based on typical stale-listing flexibility.
- Recommended offer: $2.47M (38.1% below list) — sets the bar for 1% rule.
- Local home prices are declining (-3.0%/yr); year-one equity from $28k of loan paydown is wiped out by about $120k of value loss. Plan a longer hold.
- Location reads 60/100 on livability (#1,007 in NY) — a middle-class / working-renter tenant base. Strengths: crime A+, employment A+; Watch: schools D+, amenities F, commute F.
- East Hampton Union Free School District (town): math 62% / reading 66% proficiency, ranked #159 of 590 in NY (top 27%) — acceptable for families but not a draw, mixed tenant base, ~2y average lease.
- Market conditions: Rents rising fast (+12.3%/yr); 135 active listings in the ZIP; 6 comparable units currently listed for rent nearby; rentals at typical pace (median 25d on market — plan ~3-4 weeks tenant-placement turnaround); high-income renter base; 1,366 units permitted in Suffolk County in 2024 (216 in 5+ unit buildings).
- Suffolk County population projected to shrink 5% by 2050 — rents likely to lag national; underwrite the cash flow, not the appreciation.
- Current owner paid $1.40M; list at $4.00M implies a 185% gain — meaningful room to come down on a strong offer.
- Cap rate 3.9% vs local median 7.8% in Northwest Harbor — below-typical yield; the buyer is paying a premium for something (appreciation thesis, condition, location) that the cap rate doesn't capture.
- At $24,746/mo this rent would consume 229% of the median local household income ($130k/yr) (locally 896% of renters already pay >50% of income on rent) — very limited rent-growth headroom before tenants either downsize or default.
Questions for listing agent
- What do current leases actually rent for vs. the listed asking? Can we see a recent rent roll and the last 12 months of T-12 income?
- It's been on market 91 days. Have you received any prior offers? Is the seller open to a 38% concession, seller financing, or rate buy-down credit?
- Why hasn't it sold? Are there any deal-killer items the seller is aware of (foundation, flood, title, zoning, code violations)?
- Is there a deadline driving the sale (1031 exchange, divorce, estate, relocation)? That informs how much negotiation room exists.
- Schools are D-rated, which usually means shorter tenancies and higher turnover. Who's the typical renter profile here, and what's been the actual vacancy rate?
- The area grade is low — what's the realistic commute time and amenity access for the typical tenant pool here? Any planned neighborhood developments (good or bad) we should know about?
- What's the average days-on-market for RENTAL listings here right now (not sales)? A rising rental-DOM trend means longer vacancies and softer asking-rent achievability than the comps imply.
- What's the recent tenant-quality profile in this submarket — average credit score on applications, eviction rate, late-payment / NSF rate, and stable-employment percentage? A property-management company in the area should have these aggregated.
CashFlowRE · CFR-CP0A0P1JXTPZBK
· Data 2 days ago
cashflowre.app · 2026-05-29