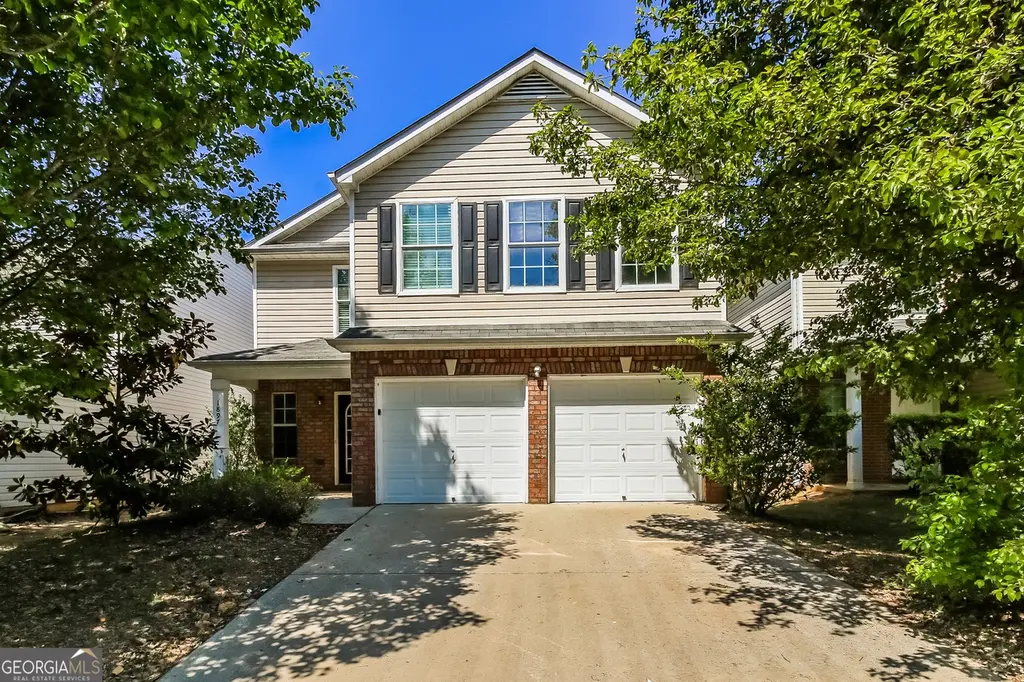
1897 Roble Dr
South Fulton, GA 30349
$310,300D-
5 bd · 3.0 ba ·
2,580 sqft ·
Built 2007
· SingleFamily
· Under Contract
· 22 DOM
Cashflow @ list (25.0% down · 7.5%)
Estimated rent
$2,378/mo
Mortgage (P&I)
−$1,627
Tax + insurance
−$507
HOA
−$65
Vac / Maint / Mgmt
−$499
Net cashflow
$-320/mo
Annual
$-3,845/yr
Cap rate
5.05%
Cash-on-cash
-4.43%
DSCR
0.80
1% rule
0.77%
Cash to close
$86,884
Investor read
- This is a 5-bed/3.0-bath single-family listed at $310k.
- At list price, monthly cash flow is $-320 ($-4k/yr) — negative.
- To cash-flow at today's rent, offer at most $254k (18.2% below list).
- To meet the 1% rule (rent ≥ 1% of price), the offer needs to be $238k (23.4% below list).
- It's been on market 22 days — a 2% lower offer ($306k) is reasonable based on typical stale-listing flexibility.
- Recommended offer: $238k (23.4% below list) — sets the bar for 1% rule.
- In year one you build about $33k of equity ($2k loan paydown + $31k appreciation (10.0% local appreciation)).
- Location reads: area grade D — affects rentability + tenant quality, not the cash-flow math above.
- Clayton County (suburban): math 11% / reading 20% proficiency, ranked #155 of 174 in GA (top 89%) — low school quality limits family demand, transient renter base, plan for 1-2y turnover; 78% free/reduced lunch — lower-income household profile, screen leases tightly.
- Zoned schools: Oliver Elementary School (math 12% / reading 27%, grade F, #878 of 1,228 statewide, top 75%, 539 students, 90% FRL); North Clayton Middle School (math 12% / reading 27%, grade F, #356 of 470 statewide, top 78%, 767 students, 90% FRL); North Clayton High School (math 2% / reading 22%, grade F, #336 of 424 statewide, top 80%, 1,206 students, 90% FRL).
- Market conditions: Rents flat; 651 active listings in the ZIP; 10 comparable units currently listed for rent nearby; rentals at typical pace (median 23d on market — plan ~3-4 weeks tenant-placement turnaround); 865 units permitted in Clayton County in 2024 (448 in 5+ unit buildings).
- Clayton County population projected at +29% by 2050 — long-run rental-demand tailwind backs the buy-and-hold thesis.
- 10 sale attempts since 13y ago with the ask held roughly flat each time — persistent listings suggest the price (not the market) is what's stuck; bring a comps-based counter.
- By year 2, paydown + projected appreciation supports a ~$53k cash-out refi (75% LTV) — recoverable capital for the next deal without selling this one.
- Climate carrying-cost: moderate wind risk, 26% chance of damaging wind over 30y; extreme-heat days projected 7→18/yr by 2055 (HVAC capex compounding) — expect insurance premiums to compound above CPI over the hold.
- This rent runs 43% of the median local income ($67k/yr) — at the standard rent-burdened threshold; future hikes will face affordability resistance.
Questions for listing agent
- What do current leases actually rent for vs. the listed asking? Can we see a recent rent roll and the last 12 months of T-12 income?
- What does the HOA fee cover, when was the last increase, and are there any pending special assessments or reserve-fund shortfalls?
- Is there a deadline driving the sale (1031 exchange, divorce, estate, relocation)? That informs how much negotiation room exists.
- The area grade is low — what's the realistic commute time and amenity access for the typical tenant pool here? Any planned neighborhood developments (good or bad) we should know about?
- What's the average days-on-market for RENTAL listings here right now (not sales)? A rising rental-DOM trend means longer vacancies and softer asking-rent achievability than the comps imply.
- What's the recent tenant-quality profile in this submarket — average credit score on applications, eviction rate, late-payment / NSF rate, and stable-employment percentage? A property-management company in the area should have these aggregated.
- How much new for-sale + rental construction is in the pipeline within 1–3 miles? Heavy new supply typically softens prices + rents 12–24 months out; constrained supply supports both.
CashFlowRE · CFR-CQ7G2F3DQM0WJD
· Data 3 weeks ago
cashflowre.app · 2026-05-29