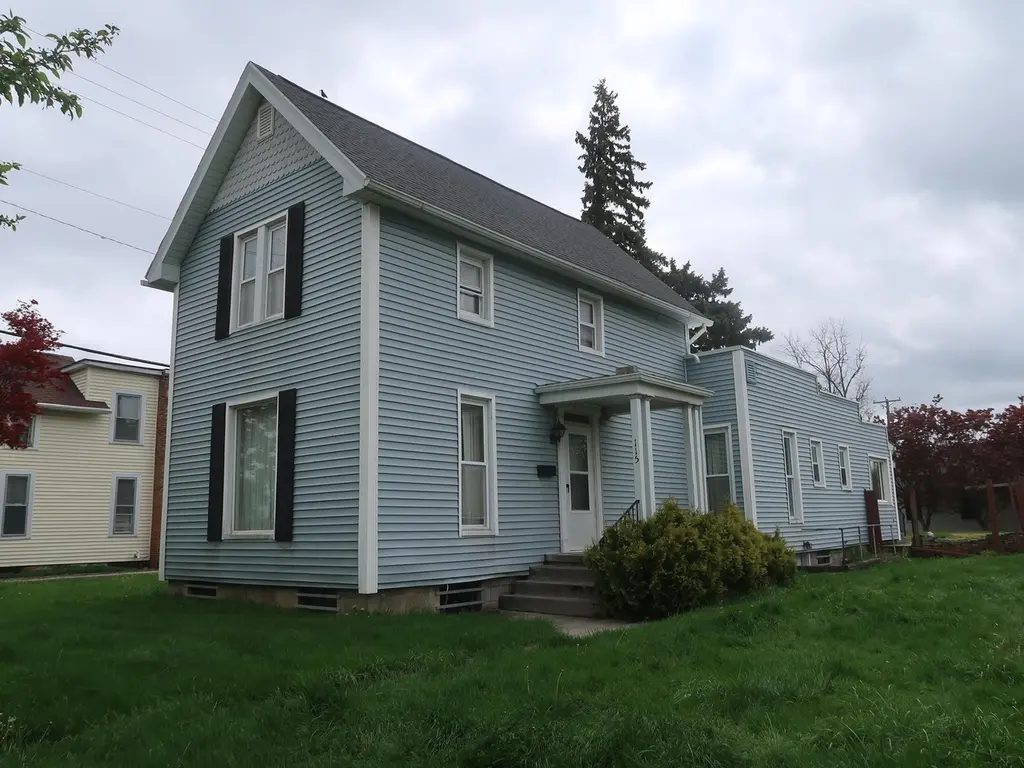
115 W Jackson St
Fostoria, OH 44830
$1F
3 bd · 1.0 ba ·
1,728 sqft ·
Built 1900
· SingleFamily
· Pending
· 30 DOM
Cashflow @ list (25.0% down · 7.5%)
Estimated rent
$757/mo
Mortgage (P&I)
−$835
Tax + insurance
−$265
HOA
−$0
Vac / Maint / Mgmt
−$159
Net cashflow
$-503/mo
Annual
$-6,032/yr
Cap rate
2.51%
Cash-on-cash
-13.53%
DSCR
0.40
1% rule
0.48%
Cash to close
$44,598
Investor read
- This is a 3-bed/1.0-bath single-family listed at $1.
- At list price, monthly cash flow is $-503 ($-6k/yr) — negative.
- The deal already cash-flows at list — no discount required.
- Meets the 1% rule at list price ($757 rent vs $1).
- It's been on market 30 days — a 2% lower offer ($0) is reasonable based on typical stale-listing flexibility.
- Local home prices are declining (-3.0%/yr); year-one equity from $1k of loan paydown is wiped out by about $5k of value loss. Plan a longer hold.
- Location reads 76/100 on livability (#216 in OH, #3,330 nationally) — a middle-class / working-renter tenant base. Strengths: cost of living A+, housing A+, health & safety A+; Watch: schools D+, commute F, employment D-.
- Fostoria City (town): math 30% / reading 39% proficiency, ranked #566 of 656 in OH (top 86%) — families likely to look elsewhere, expect single-tenant / working-renter base with shorter leases; 70% free/reduced lunch — lower-income household profile, screen leases tightly.
- Watch-outs: property tax is 238917.1% of price; built in 1900 — expect roof / HVAC / electrical / plumbing capex.
- Market conditions: 44 active listings in the ZIP; 1 comparable units currently listed for rent nearby; 45 units permitted in Seneca County in 2024 (0 in 5+ unit buildings).
- Seneca County population projected at -14% by 2050 — secular population decline; favor cash flow + early exit over multi-decade hold.
- Cap rate 2.5% vs local median 4.4% in Fostoria — below-typical yield; the buyer is paying a premium for something (appreciation thesis, condition, location) that the cap rate doesn't capture.
- This rent is only 15% of the median local income ($62k/yr) — well below the 30% rent-burden line; pricing power to push rent on renewal without tenant pushback.
Questions for listing agent
- What do current leases actually rent for vs. the listed asking? Can we see a recent rent roll and the last 12 months of T-12 income?
- Built in 1900 — when were the roof, HVAC, electrical panel, plumbing, and water heater last replaced?
- Property tax is high relative to price — has the assessment been appealed recently, and will the sale trigger a re-assessment?
- Is there a deadline driving the sale (1031 exchange, divorce, estate, relocation)? That informs how much negotiation room exists.
- Schools are D-rated, which usually means shorter tenancies and higher turnover. Who's the typical renter profile here, and what's been the actual vacancy rate?
- The area grade is low — what's the realistic commute time and amenity access for the typical tenant pool here? Any planned neighborhood developments (good or bad) we should know about?
- What's the average days-on-market for RENTAL listings here right now (not sales)? A rising rental-DOM trend means longer vacancies and softer asking-rent achievability than the comps imply.
- What's the recent tenant-quality profile in this submarket — average credit score on applications, eviction rate, late-payment / NSF rate, and stable-employment percentage? A property-management company in the area should have these aggregated.
CashFlowRE · CFR-CRCME9D6JD3BTC
· Data 3 weeks ago
cashflowre.app · 2026-05-29