 🔨 Auction
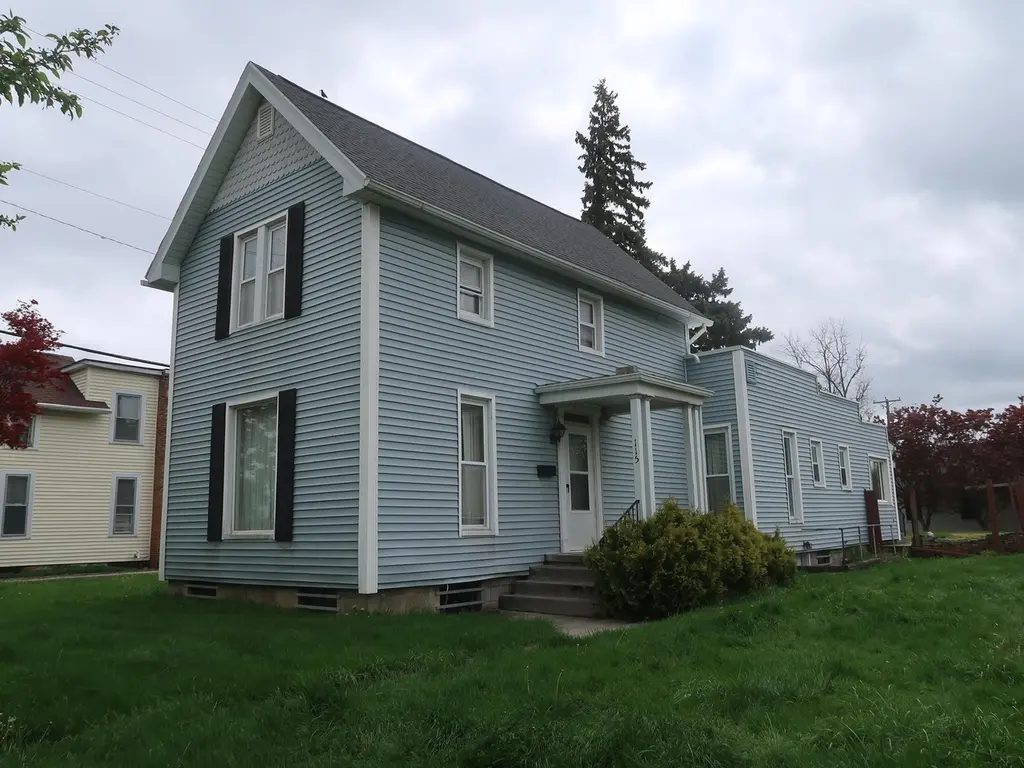
115 W Jackson St · Fostoria, OH
Flood risk 1/10 · Minimal
- FEMA flood zone
- X (unshaded)
- Chance of flooding over 30 yrs
- 0.0%
- Est. flood insurance / yr
- $473 – $860
Fire risk 1/10 · Minimal
- Est. fire insurance / yr
- $713 – $1,323
Heat risk 3/10 · Minor
- Hot days now (above 99°F)
- 7 days/yr
- Hot days in 30 yrs
- 17 days/yr
Wind risk 2/10 · Minimal
- Chance of severe wind over 30 yrs
- —
Air-quality risk 2/10 · Minimal
- Unhealthy air days now
- 1 days/yr
- Unhealthy air days in 30 yrs
- 2 days/yr
Risk factors via First Street. Map © Google.
Why this score? — see what drove the F grade
The composite is a weighted blend of 9 inputs, each scored 0–100. Each bar is that input's sub-score; the figure is the points it added to the 100-point composite (weight × sub-score).
- ARV discount +7.5/15.0
- Livability +3.8/5.0
- Cash flow +3.2/30.0
- Schools +2.9/10.0
- Rent growth +2.5/5.0
- Condition / age +2.5/5.0
- 1% rule +0.0/10.0
- DSCR +0.0/10.0
- Appreciation +0.0/10.0
$1
🖨 Deal sheet 📄 Offer letter ✓ Due diligence
Listing remarks
Auction May 28th at 6PM - This two-story home offers three bedrooms and one bathroom across more than 1,700 square feet of living space, complete with large basement, hardwood floors, and timeless character throughout. A standout feature is the expansive detached garage at the rear of the property - ideal for multiple vehicles, hobbyists, or workshop use - enhanced by a finished loft above that has previously served as a bright and inspiring art studio. Terms: The property sells with Power of Attorney's Confirmation in AS-IS condition. A $10,000 non-refundable down payment is due auction day with balance due at closing within 40 days. Any inspections desired by the potential buyers are at t
Key facts
- Finished loft
- Art studio
- Detached garage
Tags
Property features AI
Finance
- Financial info: Subject to auction and standard listing conditions
Exterior
- Parking: Detached 2-car garage with garage door opener; On-street parking
- Utilities: Public water; Public sewer
- Home design: Single-family residence; Two levels; Built in 1900; No shared/common walls
- Construction: Block foundation; Built in 1900
- Exterior features: Shed(s) and outbuilding; Block foundation
Interior
- Bedrooms: One main-level bedroom
- Flooring: Wood floors
- Bathrooms: One full bathroom
- Heating & cooling: Forced-air heating; Central air conditioning
- Interior features: Decorative fireplace; Walk-up partial basement; 1,728 total living area; Wood flooring
Neighborhood map
What this means for you Summary
Snapshot
- This is a 3-bed/1.0-bath single-family listed at $1.
Deal economics
- At list price, monthly cash flow is $-503 ($-6k/yr) — negative.
- The deal already cash-flows at list — no discount required.
- Meets the 1% rule at list price ($757 rent vs $1).
- Cap rate 2.5% vs local median 4.4% in Fostoria — below-typical yield; the buyer is paying a premium for something (appreciation thesis, condition, location) that the cap rate doesn't capture.
Location & tenants
- Location reads 76/100 on livability (#216 in OH, #3,330 nationally) — a middle-class / working-renter tenant base. Strengths: cost of living A+, housing A+, health & safety A+; Watch: schools D+, commute F, employment D-.
- Fostoria City (town): math 30% / reading 39% proficiency, ranked #566 of 656 in OH (top 86%) — families likely to look elsewhere, expect single-tenant / working-renter base with shorter leases; 70% free/reduced lunch — lower-income household profile, screen leases tightly.
- Market conditions: 44 active listings in the ZIP; 1 comparable units currently listed for rent nearby; 45 units permitted in Seneca County in 2024 (0 in 5+ unit buildings).
- This rent is only 15% of the median local income ($62k/yr) — well below the 30% rent-burden line; pricing power to push rent on renewal without tenant pushback.
Forward outlook
- Local home prices are declining (-3.0%/yr); year-one equity from $1k of loan paydown is wiped out by about $5k of value loss. Plan a longer hold.
- Seneca County population projected at -14% by 2050 — secular population decline; favor cash flow + early exit over multi-decade hold.
Negotiation context
- It's been on market 30 days — a 2% lower offer ($0) is reasonable based on typical stale-listing flexibility.
Risks & watch-outs
- Watch-outs: property tax is 238917.1% of price; built in 1900 — expect roof / HVAC / electrical / plumbing capex.
Questions for the listing agent
- What do current leases actually rent for vs. the listed asking? Can we see a recent rent roll and the last 12 months of T-12 income?
- Built in 1900 — when were the roof, HVAC, electrical panel, plumbing, and water heater last replaced?
- Property tax is high relative to price — has the assessment been appealed recently, and will the sale trigger a re-assessment?
- Is there a deadline driving the sale (1031 exchange, divorce, estate, relocation)? That informs how much negotiation room exists.
- Schools are D-rated, which usually means shorter tenancies and higher turnover. Who's the typical renter profile here, and what's been the actual vacancy rate?
- The area grade is low — what's the realistic commute time and amenity access for the typical tenant pool here? Any planned neighborhood developments (good or bad) we should know about?
- What's the average days-on-market for RENTAL listings here right now (not sales)? A rising rental-DOM trend means longer vacancies and softer asking-rent achievability than the comps imply.
- What's the recent tenant-quality profile in this submarket — average credit score on applications, eviction rate, late-payment / NSF rate, and stable-employment percentage? A property-management company in the area should have these aggregated.
- How much new for-sale + rental construction is in the pipeline within 1–3 miles? Heavy new supply typically softens prices + rents 12–24 months out; constrained supply supports both.
Investment metrics
- 1% rule
- 0.48% ✗
- Cap rate
- 2.51%
- Cash-on-cash
- -13.53%
- DSCR
- 0.40
- GRM
- 17.5
CMA / ARV
- ARV (median comp)
- $159,278
- List price
- $1
- Delta
- -100.00%
- Verdict
- UNDERPRICED
- Comps
- 20 within 1.0 mi
Show comp detail 12 sales within ~0.75 mi
| Address | Dist | Beds/Ba | Sqft | Sold | Price | $/sf | Match |
|---|---|---|---|---|---|---|---|
| 160 Elm St | 0.19mi | 3/1.5 | 1,706 (-1%) | 6mo | $150,000 | $88 | 82 |
| 900 Leonard St | 0.16mi | 3/1.5 | 1,830 (+6%) | 11mo | $157,000 | $86 | 72 |
| 825 Cory St | 0.28mi | 3/1.5 | 1,680 (-3%) | 11mo | $167,900 | $100 | 71 |
| 911 N Main St | 0.16mi | 4/2.5 (+1) | 1,855 (+7%) | 2mo | $215,000 | $116 | 68 |
| 325 Perry St | 0.31mi | 3/2.0 | 1,806 (+4%) | 8mo | $165,000 | $91 | 67 |
| 234 W High St | 0.35mi | 3/2.0 | 1,774 (+3%) | 10mo | $78,000 | $44 | 67 |
| 633 Maple St | 0.13mi | 3/1.5 | 1,497 (-13%) | 7mo | $158,000 | $106 | 64 |
| 211 Summit St | 0.17mi | 3/1.5 | 1,516 (-12%) | 6mo | $80,000 | $53 | 64 |
| 713 N Vine St | 0.60mi | 3/1.5 | 1,724 (-0%) | 12mo | $210,270 | $122 | 60 |
| 652 W Fremont St | 0.68mi | 3/1.5 | 1,660 (-4%) | 12mo | $144,000 | $87 | 49 |
| 509 College Ave | 0.70mi | 3/1.5 | 1,582 (-8%) | 5mo | $157,500 | $100 | 47 |
| 508 Short Elm St | 0.56mi | 4/1.0 (+1) | 1,499 (-13%) | 3mo | $155,000 | $103 | 44 |
Match score weights: distance 35% · size 25% · config 20% · recency 20%. Top-matched comps best support the ARV.
Projected returns pro-forma
-3.0% appreciation · 3.0% rent growth · sell at horizon
- IRR
- -41.7%
- Equity multiple
- -0.30×
- Total profit
- $-57,816
- Equity at exit
- $23,749
- IRR
- -70.1%
- Equity multiple
- -1.05×
- Total profit
- $-91,526
- Equity at exit
- $13,771
Cash invested: $44,598 (down + closing). Projections, not guarantees.
Landlord ↔ Tenant lean methodology
- Overall (STATE)
- 73 Landlord-Friendly
- State Ohio
- 73 Landlord-Friendly · R+6
- County
- — inherits STATE
- City
- — inherits STATE
ZIP-level market 44830
- Home prices YoY
- -16.1%
- Active inventory
- 44
Monthly cashflow live
- Estimated rent
- $757 medium interval (Pro) →
- Mortgage (P&I)
- −$835
- Tax est. 1.5%
- −$199 /mo · $2,389/yr
- Insurance
- −$66
- HOA
- −$0
- Vacancy / Maint / Mgmt
- −$159
- Net cashflow
- $-503
Break-even live
UW: 25.0% down · 7.5% · 30yr · 1.5% tax · 5.0% vac · 8.0% maint · 8.0% mgmt
Financing live
Cash to close
- Down payment
- $39,820
- Closing costs
- $4,778
- Reserves months
- —
- Total cash needed
- —
Loan-product check · same deal, 3 products live
Conventional
25% down · 7.5% · 30yr
- Down + closing
- —
- Monthly P&I
- —
- Monthly cashflow
- —
- DSCR
- —
- Eligible?
- —
Personal DTI + credit; lowest rate.
DSCR
20% down · 8.5% · 30yr
- Down + closing
- —
- Monthly P&I
- —
- Monthly cashflow
- —
- DSCR
- —
- Eligible?
- —
No personal income docs; deal must DSCR.
Hard money
10% down · 12.0% · 12mo
- Down + closing
- —
- Monthly P&I
- —
- Monthly cashflow
- —
- DSCR
- —
- Eligible?
- —
Short-term bridge; refi at stabilization.
Rent comps 1 comps
| Address | Beds | Baths | Sqft | Rent | $/sqft | DOM | Units | Dist |
|---|---|---|---|---|---|---|---|---|
| 595 Stearns Rd Fostoria, OH | 2.0 | 1.0–1.5 | 986 | $757 | $0.77 | 1d | 3 | 1.04mi |
Listing history 1 events
-
2026-04-28$1 Active 931-char remark
ⓘ Source: listings_history table (triggers on properties + properties_extension) + one-shot
backfill from property_details.listing_events for pre-trigger history.
Climate risk First Street
- Flood 1/10 Low FEMA zone X (unshaded) · 0% chance over 30 yrs
- Wildfire 1/10 Low
- Heat 3/10 Moderate 7 d/yr ≥99°F today · 17 d/yr by 30 yrs out
- Wind 2/10 Low
- Air quality 2/10 Low 1 unhealthy d/yr today · 2 by 30 yrs out
Nearby sold comps map
Loading sold comps map…
Walkable amenities ~0.75 mi
Loading nearby amenities…
Taxation est. · year 1
- Rental income
- $9,084
- − Mortgage interest
- −$8,922
- − Property taxes
- −$2,389
- − Insurance
- −$796
- − Repairs & maintenance
- −$727
- − Management
- −$727
- − Depreciation
- −$4,634
- Taxable loss
- −$9,111
- Est. tax savings @ 24.0%
- +$2,187
- After-tax cash flow
- $-3,846/yr
For passive investors: Depreciation is non-cash, so a rental often shows a tax loss while cash-flowing — sheltering income. Rental losses are passive: they offset passive income freely, and up to $25,000/yr can offset ordinary (W-2) income if you actively participate and your MAGI is under $100k (phasing out to $0 by $150k); unused losses carry forward. On sale, claimed depreciation is recaptured at up to 25%, and gains may owe capital-gains tax (a 1031 exchange can defer both). Figures are a year-1 estimate at your 24.0% rate — not tax advice; consult a CPA.
Schools (NCES district)
- District
- Fostoria City
- NCES district ID
- 3904399
- Math proficiency
- 30% ▼ -21.00%
- Reading proficiency
- 39% ▼ -10.00%
- Median HH income
- $36,902
- Composite
- 28.65/100
- National rank
- #6702
- State rank
- #566 of 656 in OH
Livability — Fostoria
- Score
- 76/100
- State rank
- #216
- US rank
- #3330
Category grades
Schools grade is shown separately in the Schools card above.
Census & demographics
- Census place
- Fostoria, OH
- County
- Seneca · 70,739 people
- City population
- 18,409
- Population (ZIP)
- 18,409
- Household income
- $61,589
- Rent vs Own
- Severe rent burden
- 9.8
Population outlook (Seneca County) Hauer SSP2
- Today (2025)
- 54,243 people
- By 2030
- 52,947 · -2.4%
- By 2040
- 49,842 · -8.1%
- By 2050
- 46,689 · -13.9%
- By 2075
- 39,889 · -26.5%
- By 2100
- 32,155 · -40.7%
Race, ethnicity, and origin ACS 2023
- Neighborhood character
- Predominantly White (80%)
- Race & ethnicity
- White 80% Hispanic / Latino 10% Two or more races 7% Black 3% Asian 1%
- Hispanic origin (detail)
- Mexican 9%
- Common ancestry
- Lithuanian 2% Italian 2% Slovak 1%
- Foreign-born
- 3% · Canada, South Korea
- Languages at home
- 94% English-only · Spanish 4%
Political lean MEDSL · Seneca
- 2024 margin
- Solid R (+37.5) · D 30.7% · R 68.2% · Other 1.0%
- 2008→2024 swing
- -34.8pp toward R · 2008: -2.7pp · 2024: -37.5pp
- All cycles
- 2024: R+37.5 2020: R+34.2 2016: R+31.2 2012: R+8.4 2008: R+2.7
Not yet ingested
- Civics
- —
Market trends
- HPI YoY
- ▼ -42.93%
- Current HPI
- 224.2583
- Rent YoY
- —
- Metro
- —
- State GDP YoY
- ▲ 1.98%
- F500 in state
- 48
Industry mix (Fortune 500 HQ in OH)
| Industry | F500 HQs | Revenue |
|---|---|---|
| Insurance | 3 | $145B |
|
||
| Industrial Machinery | 3 | $49B |
|
||
| Financial Services | 3 | $24B |
|
||
| Consumer Goods | 2 | $93B |
|
||
| Aerospace / Defense | 2 | $47B |
|
||
| Utilities | 2 | $33B |
|
||
Price history
3 events — show timeline
- 2026-06-18 Sold (MLS) $105,000 CBRMLS
- 2026-05-29 Pending — CBRMLS
- 2026-04-28 Listed $1 CBRMLS
Property tax history
+3.6%/yrLatest (2025): $1,363 · -6.5% YoY. Source: county tax records.
Cash-flow waterfall
monthlySold comps — $/sqft
last 12 mo · ≤1 miLoading sold comps…