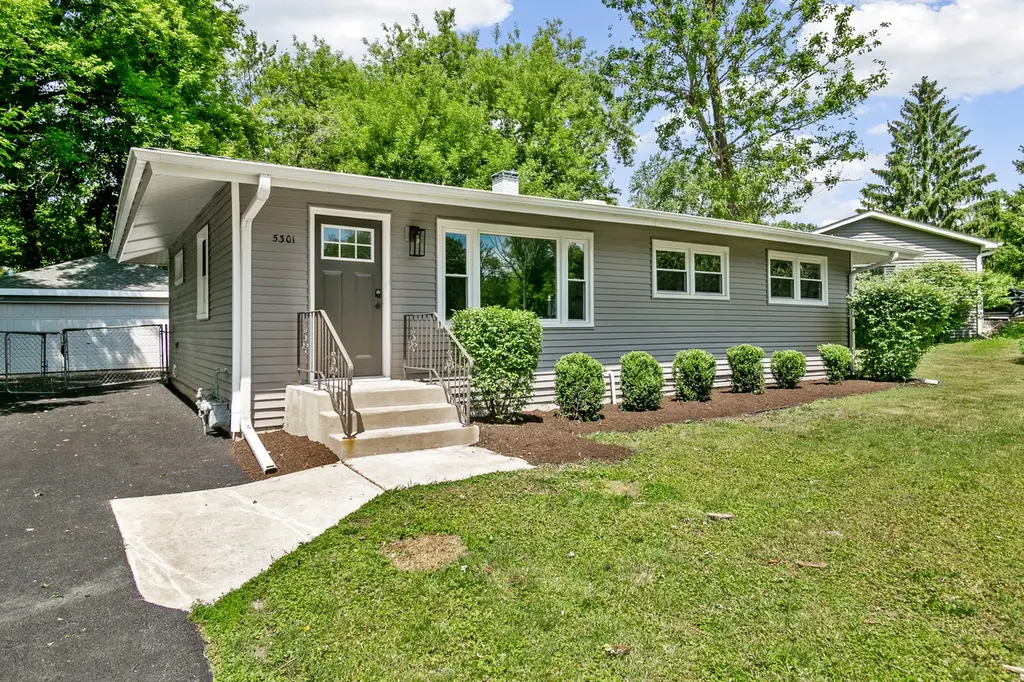
5301 Pistakee Dr
Pistakee Highlands, IL 60051
$344,700B-
3 bd · 1.0 ba ·
1,008 sqft ·
Built 1960
· SingleFamily
· Active
· 6 DOM
Cashflow @ list (25.0% down · 7.5%)
Estimated rent
$4,646/mo
Mortgage (P&I)
−$1,808
Tax + insurance
−$558
HOA
−$0
Vac / Maint / Mgmt
−$976
Net cashflow
$1,305/mo
Annual
$15,662/yr
Cap rate
10.84%
Cash-on-cash
16.23%
DSCR
1.72
1% rule
1.35%
Cash to close
$96,516
Investor read
- This is a 3-bed/1.0-bath single-family listed at $345k.
- At list price, monthly cash flow is $1k ($16k/yr) — positive.
- The deal already cash-flows at list — no discount required.
- Meets the 1% rule at list price ($5k rent vs $345k).
- Only 6 days on market — expect competitive offers; lowballing is unlikely to land.
- In year one you build about $37k of equity ($2k loan paydown + $34k appreciation (10.0% local appreciation)).
- Location reads 65/100 on livability (#603 in IL) — a middle-class / working-renter tenant base. Strengths: crime A+, housing A+, cost of living A; Watch: amenities F, commute F, health & safety F.
- Johnsburg CUSD 12 (suburban): math 22% / reading 21% proficiency, ranked #321 of 620 in IL (top 52%) — low school quality limits family demand, transient renter base, plan for 1-2y turnover; only 19% free/reduced lunch — higher-income household profile.
- Zoned schools: Johnsburg Elementary School (math 19% / reading 10%, grade F, #1,278 of 2,056 statewide, top 65%, 366 students, 0% FRL); Johnsburg Jr High School (math 23% / reading 26%, grade F, #332 of 665 statewide, top 55%, 344 students, 0% FRL); Johnsburg High School (math 27% / reading 32%, grade F, #187 of 693 statewide, top 30%, 560 students, 0% FRL) — zoned schools average 0% FRL vs 19% district-wide (19 pts lower); this property's tenant base skews higher-income than the district average.
- Market conditions: 152 active listings in the ZIP; 3 comparable units currently listed for rent nearby; rentals lingering (median 44d on market — plan ~5-8 weeks vacancy on turnover, expect pricing pressure); 67% of comp listings sitting > 30 days — soft ceiling on asking rent; 1,595 units permitted in McHenry County in 2024 (485 in 5+ unit buildings).
- McHenry County population projected at -12% by 2050 — secular population decline; favor cash flow + early exit over multi-decade hold.
- 15 sale attempts since 7y ago with the ask held roughly flat each time — persistent listings suggest the price (not the market) is what's stuck; bring a comps-based counter.
- Current owner paid $205k; list at $345k implies a 68% gain — meaningful room to come down on a strong offer.
- At projected returns (10.0% appreciation + 3.0% rent growth), your $97k cash investment doubles in ~2 years — after that, you're playing with house money.
- By year 2, paydown + projected appreciation supports a ~$59k cash-out refi (75% LTV) — recoverable capital for the next deal without selling this one.
Questions for listing agent
- Built in 1960 — when were the roof, HVAC, electrical panel, plumbing, and water heater last replaced?
- Is there a deadline driving the sale (1031 exchange, divorce, estate, relocation)? That informs how much negotiation room exists.
- Schools are D-rated, which usually means shorter tenancies and higher turnover. Who's the typical renter profile here, and what's been the actual vacancy rate?
- What's the average days-on-market for RENTAL listings here right now (not sales)? A rising rental-DOM trend means longer vacancies and softer asking-rent achievability than the comps imply.
- What's the recent tenant-quality profile in this submarket — average credit score on applications, eviction rate, late-payment / NSF rate, and stable-employment percentage? A property-management company in the area should have these aggregated.
- How much new for-sale + rental construction is in the pipeline within 1–3 miles? Heavy new supply typically softens prices + rents 12–24 months out; constrained supply supports both.
CashFlowRE · CFR-CS0B8F6PWCTVVP
· Data 2 days ago
cashflowre.app · 2026-05-29