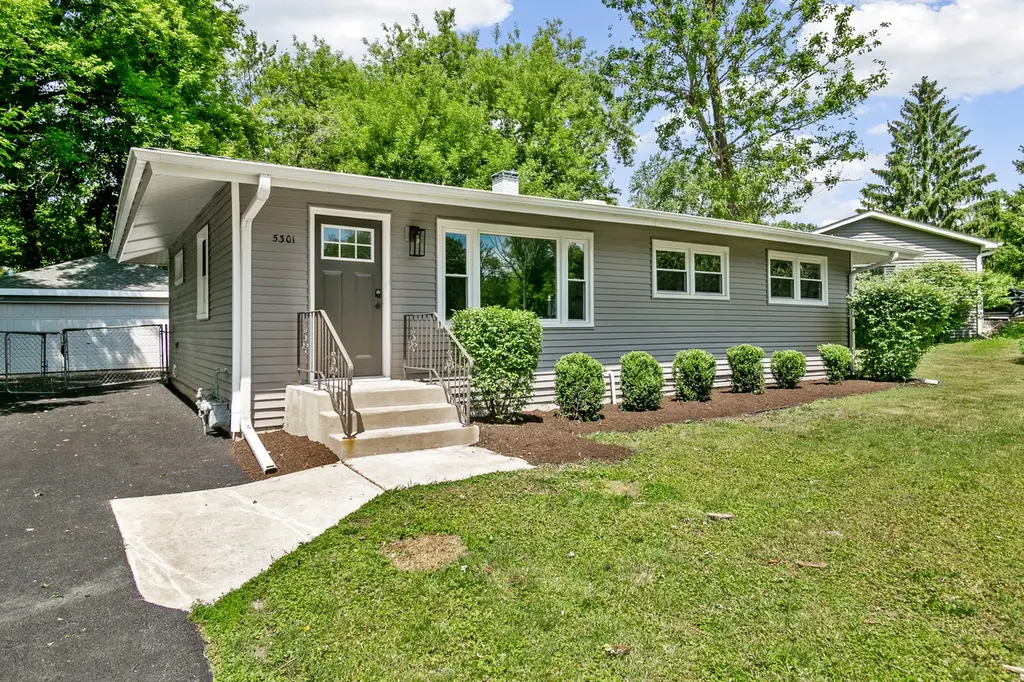
5301 Pistakee Dr · Pistakee Highlands, IL
Flood risk 1/10 · Minimal
- FEMA flood zone
- X (unshaded)
- Chance of flooding over 30 yrs
- 0.0%
- Est. flood insurance / yr
- $507 – $1,088
Fire risk 3/10 · Minor
- Est. fire insurance / yr
- $804 – $1,492
Heat risk 2/10 · Minimal
- Hot days now (above 101°F)
- 7 days/yr
- Hot days in 30 yrs
- 14 days/yr
Wind risk 2/10 · Minimal
- Chance of severe wind over 30 yrs
- —
Air-quality risk 2/10 · Minimal
- Unhealthy air days now
- 1 days/yr
- Unhealthy air days in 30 yrs
- 1 days/yr
Risk factors via First Street. Map © Google.
Why this score? — see what drove the B- grade
The composite is a weighted blend of 9 inputs, each scored 0–100. Each bar is that input's sub-score; the figure is the points it added to the 100-point composite (weight × sub-score).
- Cash flow +30.0/30.0
- DSCR +10.0/10.0
- Appreciation +10.0/10.0
- 1% rule +8.5/10.0
- Livability +3.2/5.0
- Rent growth +2.5/5.0
- Condition / age +2.5/5.0
- Schools +2.2/10.0
- ARV discount +0.0/15.0
$344,700
🖨 Deal sheet 📄 Offer letter ✓ Due diligence
Listing remarks MLS
Step into your next home! This home features 3 bedrooms, 1 bathroom, all hardwood floors for easy maintenance. The home brings natural lighting and has a great backyard for entertaining! Home being sold AS IS.
Key facts
- Quartz countertops
- Updated kitchen
- New lvp flooring
Tags
Property features AI
Finance
- Other: Ownership is fee simple; Property not currently leased; School bus service available
- HOA & community: No master association fee required
Exterior
- Parking: Detached garage (garage owned); Asphalt driveway; Total 2 parking spaces, 2 garage spaces
- Utilities: Public water; Septic tank sewer; Electric with circuit breakers
- Home design: Detached single-family home; One-story
- Construction: Vinyl siding exterior; Asphalt roof; Concrete perimeter foundation; Built approximately 61–70 years ago; Rehab completed in 2026
- Exterior features: Fenced yard; Mature trees; Street paved
Interior
- Kitchen: Updated kitchen with solid surface counters; Eating area / table space; Range; Microwave; Dishwasher; Refrigerator
- Bedrooms: 3 bedrooms (all on main level)
- Flooring: Hardwood flooring in most living areas and bedrooms; Luxury vinyl in the kitchen
- Bathrooms: 1 full bathroom
- Heating & cooling: Natural gas forced-air heating; Central air conditioning
- Interior features: First-floor bedroom; First-floor full bathroom; Kitchen/dining combo; Full attic; Crawl space basement; Some photos virtually staged
- Laundry & utility: Main-level laundry located in the kitchen; Sump pump
Neighborhood map
What this means for you Summary
Snapshot
- This is a 3-bed/1.0-bath single-family listed at $345k.
Deal economics
- At list price, monthly cash flow is $1k ($16k/yr) — positive.
- The deal already cash-flows at list — no discount required.
- Meets the 1% rule at list price ($5k rent vs $345k).
Location & tenants
- Location reads 65/100 on livability (#603 in IL) — a middle-class / working-renter tenant base. Strengths: crime A+, housing A+, cost of living A; Watch: amenities F, commute F, health & safety F.
- Johnsburg CUSD 12 (suburban): math 22% / reading 21% proficiency, ranked #321 of 620 in IL (top 52%) — low school quality limits family demand, transient renter base, plan for 1-2y turnover; only 19% free/reduced lunch — higher-income household profile.
- Zoned schools: Johnsburg Elementary School (math 19% / reading 10%, grade F, #1,278 of 2,056 statewide, top 65%, 366 students, 0% FRL); Johnsburg Jr High School (math 23% / reading 26%, grade F, #332 of 665 statewide, top 55%, 344 students, 0% FRL); Johnsburg High School (math 27% / reading 32%, grade F, #187 of 693 statewide, top 30%, 560 students, 0% FRL) — zoned schools average 0% FRL vs 19% district-wide (19 pts lower); this property's tenant base skews higher-income than the district average.
- Market conditions: 152 active listings in the ZIP; 3 comparable units currently listed for rent nearby; rentals lingering (median 44d on market — plan ~5-8 weeks vacancy on turnover, expect pricing pressure); 67% of comp listings sitting > 30 days — soft ceiling on asking rent; 1,595 units permitted in McHenry County in 2024 (485 in 5+ unit buildings).
Forward outlook
- In year one you build about $37k of equity ($2k loan paydown + $34k appreciation (10.0% local appreciation)).
- McHenry County population projected at -12% by 2050 — secular population decline; favor cash flow + early exit over multi-decade hold.
- At projected returns (10.0% appreciation + 3.0% rent growth), your $97k cash investment doubles in ~2 years — after that, you're playing with house money.
- By year 2, paydown + projected appreciation supports a ~$59k cash-out refi (75% LTV) — recoverable capital for the next deal without selling this one.
Negotiation context
- Only 6 days on market — expect competitive offers; lowballing is unlikely to land.
- 15 sale attempts since 7y ago with the ask held roughly flat each time — persistent listings suggest the price (not the market) is what's stuck; bring a comps-based counter.
- Current owner paid $205k; list at $345k implies a 68% gain — meaningful room to come down on a strong offer.
Questions for the listing agent
- Built in 1960 — when were the roof, HVAC, electrical panel, plumbing, and water heater last replaced?
- Is there a deadline driving the sale (1031 exchange, divorce, estate, relocation)? That informs how much negotiation room exists.
- Schools are D-rated, which usually means shorter tenancies and higher turnover. Who's the typical renter profile here, and what's been the actual vacancy rate?
- What's the average days-on-market for RENTAL listings here right now (not sales)? A rising rental-DOM trend means longer vacancies and softer asking-rent achievability than the comps imply.
- What's the recent tenant-quality profile in this submarket — average credit score on applications, eviction rate, late-payment / NSF rate, and stable-employment percentage? A property-management company in the area should have these aggregated.
- How much new for-sale + rental construction is in the pipeline within 1–3 miles? Heavy new supply typically softens prices + rents 12–24 months out; constrained supply supports both.
Investment metrics
- 1% rule
- 1.35% ✓
- Cap rate
- 10.84%
- Cash-on-cash
- 16.23%
- DSCR
- 1.72
- GRM
- 6.2
CMA / ARV
- ARV (on-the-fly)
- $255,024
- Comps found
- 12
Show comp detail 12 sales within ~0.75 mi
| Address | Dist | Beds/Ba | Sqft | Sold | Price | $/sf | Match |
|---|---|---|---|---|---|---|---|
| 5301 Pistakee Dr | 0.00mi | 3/1.0 | 1,008 (0%) | 3mo | $205,000 | $203 | 97 |
| 5108 N West St | 0.20mi | 3/2.0 | 1,034 (+3%) | 11mo | $330,000 | $319 | 73 |
| 5406 Memory Trl | 0.21mi | 2/1.0 (-1) | 924 (-8%) | 6mo | $235,000 | $254 | 66 |
| 5703 N Woodland Dr | 0.43mi | 4/2.0 (+1) | 980 (-3%) | 1mo | $300,500 | $307 | 66 |
| 5703 Fox Lake Rd | 0.49mi | 2/1.0 (-1) | 960 (-5%) | 4mo | $223,000 | $232 | 60 |
| 5305 N Highland Dr | 0.36mi | 3/1.5 | 1,104 (+10%) | 11mo | $269,900 | $244 | 57 |
| 1007 Oeffling Dr | 0.62mi | 2/1.0 (-1) | 1,040 (+3%) | 5mo | $305,000 | $293 | 56 |
| 5502 Thelen Ave | 0.49mi | 3/2.0 | 1,058 (+5%) | 11mo | $265,000 | $250 | 56 |
| 1007 W Florence St | 0.43mi | 2/1.0 (-1) | 908 (-10%) | 10mo | $230,000 | $253 | 50 |
| 5902 Fox Lake Rd | 0.67mi | 2/1.0 (-1) | 1,048 (+4%) | 9mo | $250,000 | $239 | 49 |
| 4712 Gregory St | 0.68mi | 2/1.0 (-1) | 912 (-10%) | 8mo | $235,000 | $258 | 41 |
| 5215 N Pleasant View Dr | 0.66mi | 2/1.0 (-1) | 1,128 (+12%) | 9mo | $265,000 | $235 | 37 |
Match score weights: distance 35% · size 25% · config 20% · recency 20%. Top-matched comps best support the ARV.
Projected returns pro-forma
10.0% appreciation · 3.0% rent growth · sell at horizon
- IRR
- 36.3%
- Equity multiple
- 3.81×
- Total profit
- $270,917
- Equity at exit
- $310,533
- IRR
- 31.3%
- Equity multiple
- 8.59×
- Total profit
- $732,556
- Equity at exit
- $669,676
Cash invested: $96,516 (down + closing). Projections, not guarantees.
Landlord ↔ Tenant lean methodology
- Overall (STATE)
- 43 Moderately Tenant-Leaning
- State Illinois
- 43 Moderately Tenant-Leaning · D+7
- County
- — inherits STATE
- City
- — inherits STATE
ZIP-level market 60051
- Home prices YoY
- 4.9%
- Active inventory
- 152
- Price-to-rent
- 6.2×
Monthly cashflow live
- Estimated rent
- $4,646 medium interval (Pro) →
- Mortgage (P&I)
- −$1,808
- Tax from tax record
- −$414 /mo · $4,970/yr
- Insurance
- −$144
- HOA
- −$0
- Vacancy / Maint / Mgmt
- −$976
- Net cashflow
- $1,305
Break-even live
UW: 25.0% down · 7.5% · 30yr · 1.5% tax · 5.0% vac · 8.0% maint · 8.0% mgmt
Financing live
Cash to close
- Down payment
- $86,175
- Closing costs
- $10,341
- Reserves months
- —
- Total cash needed
- —
Loan-product check · same deal, 3 products live
Conventional
25% down · 7.5% · 30yr
- Down + closing
- —
- Monthly P&I
- —
- Monthly cashflow
- —
- DSCR
- —
- Eligible?
- —
Personal DTI + credit; lowest rate.
DSCR
20% down · 8.5% · 30yr
- Down + closing
- —
- Monthly P&I
- —
- Monthly cashflow
- —
- DSCR
- —
- Eligible?
- —
No personal income docs; deal must DSCR.
Hard money
10% down · 12.0% · 12mo
- Down + closing
- —
- Monthly P&I
- —
- Monthly cashflow
- —
- DSCR
- —
- Eligible?
- —
Short-term bridge; refi at stabilization.
Rent comps 3 comps
| Address | Beds | Baths | Sqft | Rent | $/sqft | DOM | Units | Dist |
|---|---|---|---|---|---|---|---|---|
| 306 Waverly St Unit 1244943P Spring Grove, IL | 3.0 | 1.0 | 742 | $8,714 | $11.74 | 44d | 1 | 1.05mi |
| 6 N Pistakee Lake Rd Fox Lake, IL | 2.0 | 1.0 | 1500 | $1,750 | $1.17 | 1d | 1 | 1.39mi |
| 22 W Grand Ave Fox Lake, IL | 2.0 | 1.0 | 730 | $1,700 | $2.33 | 44d | 1 | 1.46mi |
Listing history 6 events
-
2026-06-18days on market $344,700 Active 6 DOM
-
2026-06-17days on market $344,700 Active 5 DOM
-
2026-06-16days on market $344,700 Active 4 DOM
-
2026-06-15days on market $344,700 Active 3 DOM
-
2026-06-13remarks 699-char remark
-
2026-06-13$344,700 Active 1 DOM
ⓘ Source: listings_history table (triggers on properties + properties_extension) + one-shot
backfill from property_details.listing_events for pre-trigger history.
Tax reassessment forecast IL · Partial reset (capped growth)
- Current annual tax
- $4,970 · $414/mo
- Projected year-2 tax
- $6,397 · $533/mo
- Expected delta
- +$1,427/yr (+$119/mo · 28.7%)
ⓘ Screening estimate from a state-policy table — verify with the county assessor before closing.
Climate risk First Street
- Flood 1/10 Low FEMA zone X (unshaded) · 0% chance over 30 yrs
- Wildfire 3/10 Moderate
- Heat 2/10 Low 7 d/yr ≥101°F today · 14 d/yr by 30 yrs out
- Wind 2/10 Low
- Air quality 2/10 Low 1 unhealthy d/yr today · 1 by 30 yrs out
Nearby sold comps map
Loading sold comps map…
Walkable amenities ~0.75 mi
Loading nearby amenities…
Taxation est. · year 1
- Rental income
- $55,756
- − Mortgage interest
- −$19,309
- − Property taxes
- −$4,970
- − Insurance
- −$1,724
- − Repairs & maintenance
- −$4,460
- − Management
- −$4,460
- − Depreciation
- −$10,028
- Taxable income
- $10,805
- Est. tax owed @ 24.0%
- −$2,593
- After-tax cash flow
- $13,068/yr
For passive investors: Depreciation is non-cash, so a rental often shows a tax loss while cash-flowing — sheltering income. Rental losses are passive: they offset passive income freely, and up to $25,000/yr can offset ordinary (W-2) income if you actively participate and your MAGI is under $100k (phasing out to $0 by $150k); unused losses carry forward. On sale, claimed depreciation is recaptured at up to 25%, and gains may owe capital-gains tax (a 1031 exchange can defer both). Figures are a year-1 estimate at your 24.0% rate — not tax advice; consult a CPA.
Schools (NCES district)
- District
- Johnsburg CUSD 12
- NCES district ID
- 1720490
- Math proficiency
- 22% ▼ -18.00%
- Reading proficiency
- 21% ▼ -18.00%
- Median HH income
- $79,626
- Composite
- 22.0/100
- National rank
- #8206
- State rank
- #321 of 620 in IL
Livability — Pistakee Highlands
- Score
- 65/100
- State rank
- #603
- US rank
- #12471
Category grades
Schools grade is shown separately in the Schools card above.
Census & demographics
- Census place
- Pistakee Highlands, IL
- Population (ZIP)
- 23,931
Population outlook (McHenry County) Hauer SSP2
- Today (2025)
- 305,342 people
- By 2030
- 301,491 · -1.3%
- By 2040
- 288,211 · -5.6%
- By 2050
- 268,430 · -12.1%
- By 2075
- 226,209 · -25.9%
- By 2100
- 181,247 · -40.6%
Race, ethnicity, and origin ACS 2023
- Neighborhood character
- Predominantly White (84%)
- Race & ethnicity
- White 84% Hispanic / Latino 10% Two or more races 6% Asian 2%
- Hispanic origin (detail)
- Mexican 8%
- Common ancestry
- Romanian 12% Slovak 2% Lithuanian 2%
- Foreign-born
- 5% · Canada
- Languages at home
- 92% English-only · Spanish 5% Other Indo-European 2% Russian/Polish/Slavic 1%
Political lean MEDSL · McHenry
- 2024 margin
- Lean R (+5.3) · D 46.6% · R 51.9% · Other 1.5%
- 2008→2024 swing
- -10.6pp toward R · 2008: 5.3pp · 2024: -5.3pp
- All cycles
- 2024: R+5.3 2020: R+2.5 2016: R+8.1 2012: R+8.8 2008: D+5.3
Not yet ingested
- Civics
- —
Market trends
- HPI YoY
- ▲ 28.50%
- Current HPI
- 612.07
- Rent YoY
- —
- Metro
- —
- State GDP YoY
- ▲ 1.59%
- F500 in state
- 60
Industry mix (Fortune 500 HQ in IL)
| Industry | F500 HQs | Revenue |
|---|---|---|
| Insurance | 4 | $201B |
|
||
| Consumer Goods | 4 | $87B |
|
||
| Industrial Machinery | 3 | $64B |
|
||
| Healthcare | 2 | $55B |
|
||
| Retail / Pharmacy | 1 | $148B |
|
||
| Agriculture / Food | 1 | $86B |
|
||
Price history
+580.4% since first listed39 events — show timeline
- 2026-06-12 Listed $344,700 MRED as Distributed by MLS Grid
- 2026-03-09 Sold (MLS) $205,000 MRED as Distributed by MLS Grid
- 2026-01-16 Contingent — MRED as Distributed by MLS Grid
- 2026-01-14 Listed $224,000 MRED as Distributed by MLS Grid
- 2020-11-17 Sold (Public Records) $140,000 Public Records
- 2020-11-03 Sold (MLS) $140,000 MRED as Distributed by MLS Grid
- 2020-09-21 Pending — MRED as Distributed by MLS Grid
- 2020-09-01 Listed $145,900 MRED as Distributed by MLS Grid
- 2020-08-27 Pending — MRED as Distributed by MLS Grid
- 2020-08-25 Listing Removed — MRED as Distributed by MLS Grid
- 2020-08-24 Relisted — MRED as Distributed by MLS Grid
- 2020-08-18 Pending — MRED as Distributed by MLS Grid
- 2020-08-14 Price Changed — MRED as Distributed by MLS Grid
- 2020-07-23 Relisted — MRED as Distributed by MLS Grid
- 2020-07-15 Pending — MRED as Distributed by MLS Grid
- 2020-07-14 Listing Removed — MRED as Distributed by MLS Grid
- 2020-07-14 Listed — MRED as Distributed by MLS Grid
- 2020-07-02 Relisted — MRED as Distributed by MLS Grid
- 2020-06-29 Pending — MRED as Distributed by MLS Grid
- 2020-06-24 Price Changed — MRED as Distributed by MLS Grid
- 2020-05-27 Listed — MRED as Distributed by MLS Grid
- 2019-12-13 Sold (MLS) $80,000 MRED as Distributed by MLS Grid
- 2019-11-09 Pending — MRED as Distributed by MLS Grid
- 2019-11-05 Relisted — MRED as Distributed by MLS Grid
- 2019-10-24 Pending — MRED as Distributed by MLS Grid
- 2019-10-11 Relisted — MRED as Distributed by MLS Grid
- 2019-10-09 Pending — MRED as Distributed by MLS Grid
- 2019-10-02 Listed $84,000 MRED as Distributed by MLS Grid
- 2019-09-20 Listing Removed — MRED as Distributed by MLS Grid
- 2019-09-18 Relisted — MRED as Distributed by MLS Grid
- 2019-09-07 Pending — MRED as Distributed by MLS Grid
- 2019-08-30 Relisted — MRED as Distributed by MLS Grid
- 2019-08-16 Pending — MRED as Distributed by MLS Grid
- 2019-08-05 Price Changed — MRED as Distributed by MLS Grid
- 2019-07-16 Relisted — MRED as Distributed by MLS Grid
- 2019-07-11 Contingent — MRED as Distributed by MLS Grid
- 2019-06-27 Price Changed — MRED as Distributed by MLS Grid
- 2019-05-29 Listed — MRED as Distributed by MLS Grid
- 1989-08-01 Sold (Public Records) $50,660 Public Records
Property tax history
+3.0%/yrLatest (2024): $4,970 · +26.1% YoY. Source: county tax records.
Cash-flow waterfall
monthlySold comps — $/sqft
last 12 mo · ≤1 miLoading sold comps…