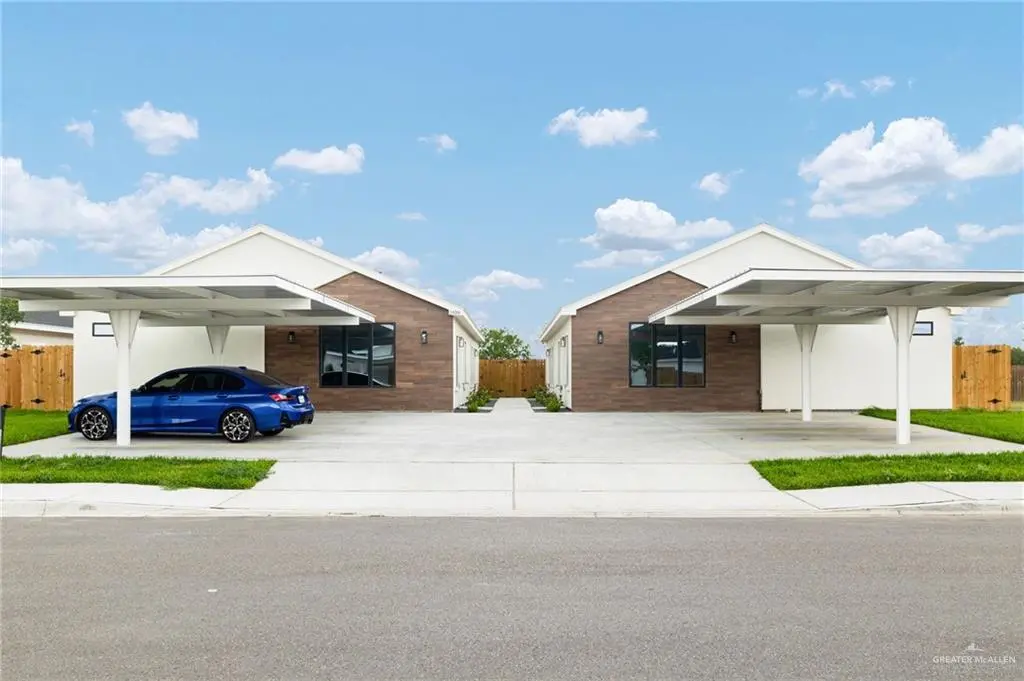
2109 Viviana St
Edinburg, TX 78504
$535,000D+
None bd · None ba ·
4,214 sqft ·
Built 2025
· MultiFamily
· Pending
· 53 DOM
Cashflow @ list (25.0% down · 7.5%)
Estimated rent
$5,516/mo
Mortgage (P&I)
−$2,806
Tax + insurance
−$892
HOA
−$63
Vac / Maint / Mgmt
−$1,158
Net cashflow
$597/mo
Annual
$7,169/yr
Cap rate
7.63%
Cash-on-cash
4.79%
DSCR
1.21
1% rule
1.03%
Cash to close
$149,800
Investor read
- This is a 2×3bd/2ba + 2×2bd/2ba units multifamily listed at $535k. Condition is rated excellent.
- At list price, monthly cash flow is $597 ($7k/yr) — positive. Per door: $149/mo.
- The deal already cash-flows at list — no discount required.
- Meets the 1% rule at list price ($6k rent vs $535k).
- It's been on market 53 days — a 3% lower offer ($519k) is reasonable based on typical stale-listing flexibility.
- Recommended offer: $519k (3.0% below list) — sets the bar for market timing.
- Local home prices are declining (-3.0%/yr); year-one equity from $4k of loan paydown is wiped out by about $16k of value loss. Plan a longer hold.
- Location reads 64/100 on livability (#784 in TX) — a middle-class / working-renter tenant base. Strengths: cost of living A+, housing A+; Watch: schools D+, employment D, amenities F.
- Edinburg CISD (urban): math 20% / reading 34% proficiency, ranked #699 of 826 in TX (top 85%) — low school quality limits family demand, transient renter base, plan for 1-2y turnover; 62% free/reduced lunch — lower-income household profile, screen leases tightly.
- Market conditions: Rents rising (+2.6%/yr); 888 active listings in the ZIP; 10 comparable units currently listed for rent nearby; rentals at typical pace (median 24d on market — plan ~3-4 weeks tenant-placement turnaround); 40% of comp listings sitting > 30 days — soft ceiling on asking rent; solid renter incomes; 7,378 units permitted in Hidalgo County in 2024 (641 in 5+ unit buildings).
- Hidalgo County population projected at +28% by 2050 — long-run rental-demand tailwind backs the buy-and-hold thesis.
- 3 sale attempts with the ask held roughly flat each time — persistent listings suggest the price (not the market) is what's stuck; bring a comps-based counter.
- Cap rate 7.6% vs local median 2.4% in Edinburg — top-decile yield for the area; either an underpriced asset or a hidden risk that comps aren't pricing in. Stress-test before assuming the spread holds.
- At $5,516/mo this rent would consume 81% of the median local household income ($82k/yr) (locally 1468% of renters already pay >50% of income on rent) — very limited rent-growth headroom before tenants either downsize or default.
Questions for listing agent
- It's been on market 53 days. Have you received any prior offers? Is the seller open to a 3% concession, seller financing, or rate buy-down credit?
- Can we see the unit-by-unit rent roll, current vacancy, and any below-market leases? What's the average tenancy length?
- What capital expenditures (roof, boiler, parking lot, exteriors) have been made in the last 5 years, and what's planned in the next 2?
- What does the HOA fee cover, when was the last increase, and are there any pending special assessments or reserve-fund shortfalls?
- Is there a deadline driving the sale (1031 exchange, divorce, estate, relocation)? That informs how much negotiation room exists.
- Schools are D-rated, which usually means shorter tenancies and higher turnover. Who's the typical renter profile here, and what's been the actual vacancy rate?
- The area grade is low — what's the realistic commute time and amenity access for the typical tenant pool here? Any planned neighborhood developments (good or bad) we should know about?
- What's the average days-on-market for RENTAL listings here right now (not sales)? A rising rental-DOM trend means longer vacancies and softer asking-rent achievability than the comps imply.
CashFlowRE · CFR-CSDH0D6MFX7WYY
· Data 1 week ago
cashflowre.app · 2026-05-29