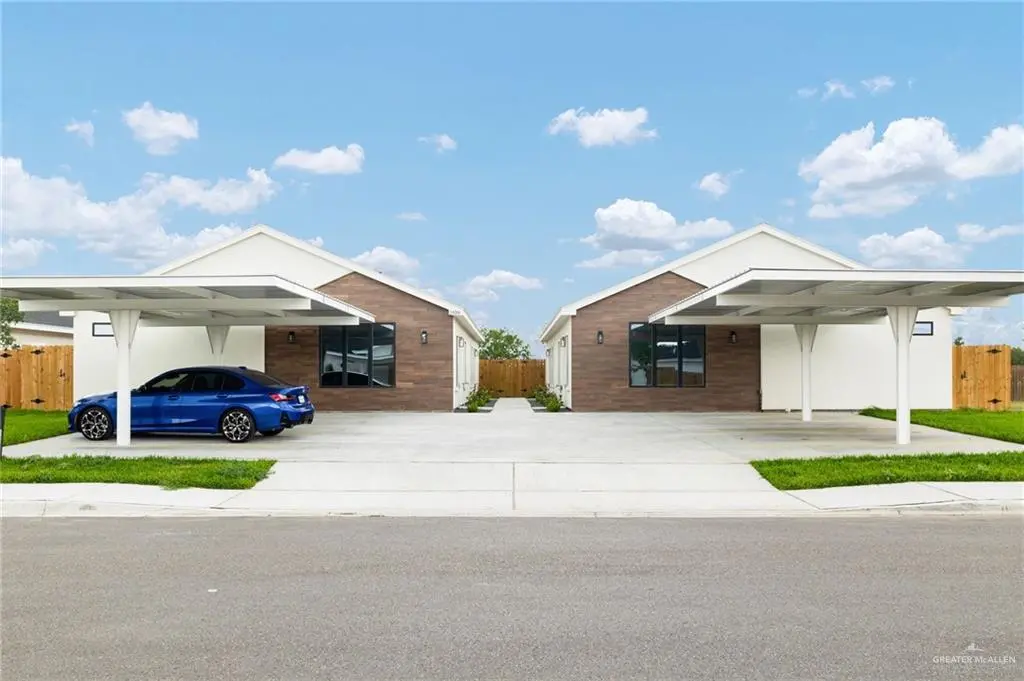
 Fourplex
2109 Viviana St · Edinburg, TX
Flood risk No data
- FEMA flood zone
- —
- Chance of flooding over 30 yrs
- —
- Est. flood insurance / yr
- —
Fire risk No data
- Est. fire insurance / yr
- —
Heat risk No data
- Hot days now (above threshold)
- —
- Hot days in 30 yrs
- —
Wind risk No data
- Chance of severe wind over 30 yrs
- —
Air-quality risk No data
- Unhealthy air days now
- —
- Unhealthy air days in 30 yrs
- —
Risk factors via First Street. Map © Google.
Why this score? — see what drove the D+ grade
The composite is a weighted blend of 9 inputs, each scored 0–100. Each bar is that input's sub-score; the figure is the points it added to the 100-point composite (weight × sub-score).
- Cash flow +19.4/30.0
- DSCR +6.1/10.0
- 1% rule +5.3/10.0
- ARV discount +5.2/15.0
- Condition / age +5.0/5.0
- Livability +3.2/5.0
- Rent growth +3.1/5.0
- Schools +2.2/10.0
- Appreciation +0.0/10.0
$535,000
🖨 Deal sheet 📄 Offer letter ✓ Due diligence
Multi-family units
County records classify this as Multi-Family (2-4 Unit). Listing-text estimate: 4 units. confirmed
Listing remarks MLS
New construction fourplex in Edinburg, TX—an excellent opportunity for investors looking to grow their portfolio! Ideally situated in a prime location, this property offers easy access to major roadways, shopping centers, grocery stores, restaurants, and a wide range of everyday conveniences. Each unit is thoughtfully designed with modern finishes and stylish fixtures, creating an attractive and comfortable living space for future tenants. The layout includes two units featuring 3 bedrooms and 2 bathrooms, along with two additional units offering 2 bedrooms and 2 bathrooms. 3 of 4 units are currently leased at $3,950/month. Unit #4 is vacant and is offered at $1,250/month. Total gross would be $5,200. With its desirable location, well-designed floor plans, and contemporary appeal, this fourplex presents strong potential for consistent rental income. Opportunities like this in Edinburg are rare—don’t miss your chance to invest in a high-demand property with long-term value.
Key facts
- Stylish fixtures
- New construction
- Modern finishes
Tags
Neighborhood map
What this means for you Summary
Snapshot
- This is a 2×3bd/2ba + 2×2bd/2ba units multifamily listed at $535k. Condition is rated excellent.
Deal economics
- At list price, monthly cash flow is $597 ($7k/yr) — positive. Per door: $149/mo.
- The deal already cash-flows at list — no discount required.
- Meets the 1% rule at list price ($6k rent vs $535k).
- Recommended offer: $519k (3.0% below list) — sets the bar for market timing.
- Cap rate 7.6% vs local median 2.4% in Edinburg — top-decile yield for the area; either an underpriced asset or a hidden risk that comps aren't pricing in. Stress-test before assuming the spread holds.
Location & tenants
- Location reads 64/100 on livability (#784 in TX) — a middle-class / working-renter tenant base. Strengths: cost of living A+, housing A+; Watch: schools D+, employment D, amenities F.
- Edinburg CISD (urban): math 20% / reading 34% proficiency, ranked #699 of 826 in TX (top 85%) — low school quality limits family demand, transient renter base, plan for 1-2y turnover; 62% free/reduced lunch — lower-income household profile, screen leases tightly.
- Market conditions: Rents rising (+2.6%/yr); 888 active listings in the ZIP; 10 comparable units currently listed for rent nearby; rentals at typical pace (median 24d on market — plan ~3-4 weeks tenant-placement turnaround); 40% of comp listings sitting > 30 days — soft ceiling on asking rent; solid renter incomes; 7,378 units permitted in Hidalgo County in 2024 (641 in 5+ unit buildings).
- At $5,516/mo this rent would consume 81% of the median local household income ($82k/yr) (locally 1468% of renters already pay >50% of income on rent) — very limited rent-growth headroom before tenants either downsize or default.
Forward outlook
- Local home prices are declining (-3.0%/yr); year-one equity from $4k of loan paydown is wiped out by about $16k of value loss. Plan a longer hold.
- Hidalgo County population projected at +28% by 2050 — long-run rental-demand tailwind backs the buy-and-hold thesis.
Negotiation context
- It's been on market 53 days — a 3% lower offer ($519k) is reasonable based on typical stale-listing flexibility.
- 3 sale attempts with the ask held roughly flat each time — persistent listings suggest the price (not the market) is what's stuck; bring a comps-based counter.
Questions for the listing agent
- It's been on market 53 days. Have you received any prior offers? Is the seller open to a 3% concession, seller financing, or rate buy-down credit?
- Can we see the unit-by-unit rent roll, current vacancy, and any below-market leases? What's the average tenancy length?
- What capital expenditures (roof, boiler, parking lot, exteriors) have been made in the last 5 years, and what's planned in the next 2?
- What does the HOA fee cover, when was the last increase, and are there any pending special assessments or reserve-fund shortfalls?
- Is there a deadline driving the sale (1031 exchange, divorce, estate, relocation)? That informs how much negotiation room exists.
- Schools are D-rated, which usually means shorter tenancies and higher turnover. Who's the typical renter profile here, and what's been the actual vacancy rate?
- The area grade is low — what's the realistic commute time and amenity access for the typical tenant pool here? Any planned neighborhood developments (good or bad) we should know about?
- What's the average days-on-market for RENTAL listings here right now (not sales)? A rising rental-DOM trend means longer vacancies and softer asking-rent achievability than the comps imply.
- What's the recent tenant-quality profile in this submarket — average credit score on applications, eviction rate, late-payment / NSF rate, and stable-employment percentage? A property-management company in the area should have these aggregated.
- How much new apartment / multifamily construction is in the pipeline within 1–3 miles? Heavy new supply (>2% of stock underway) typically softens rents 12–24 months out; light construction supports rent growth.
Investment metrics
- 1% rule
- 1.03% ✓
- Cap rate
- 7.63%
- Cash-on-cash
- 4.79%
- DSCR
- 1.21
- GRM
- 8.1
CMA / ARV
- ARV (median comp)
- $509,066
- List price
- $535,000
- Delta
- 5.09%
- Verdict
- FAIR
- Comps
- 20 within 1.0 mi
Show comp detail 11 sales within ~0.75 mi
| Address | Dist | Beds/Ba | Sqft | Sold | Price | $/sf | Match |
|---|---|---|---|---|---|---|---|
| 2309 E Viviana | 0.09mi | —/— | 4,214 (0%) | 12mo | $500,000 | $119 | 86 |
| 2305 E Viviana St | 0.12mi | —/— | 4,200 (-0%) | 13mo | $515,000 | $123 | 83 |
| 2301 E Viviana St | 0.19mi | —/— | 4,100 (-3%) | 7mo | $500,000 | $122 | 81 |
| 2300 E Viviana St | 0.19mi | —/— | 4,100 (-3%) | 10mo | $515,000 | $126 | 78 |
| 3301 S Chloe | 0.19mi | —/— | 4,200 (-0%) | 15mo | $520,000 | $124 | 78 |
| 2304 E Viviana | 0.19mi | —/— | 4,100 (-3%) | 14mo | $520,000 | $127 | 75 |
| 3215 S Chloe | 0.19mi | —/— | 4,300 (+2%) | 15mo | $520,000 | $121 | 75 |
| 2105 San Andrea St | 0.05mi | —/— | 3,844 (-9%) | 10mo | $529,000 | $138 | 75 |
| 2912 Javalina Ave | 0.57mi | —/— | 4,120 (-2%) | 18mo | $518,500 | $126 | 55 |
| 2908 Javalina Ave | 0.57mi | —/— | 4,228 (+0%) | 22mo | $525,000 | $124 | 54 |
| 3214 Luz Divina St | 0.56mi | —/— | 3,640 (-14%) | 14mo | $420,000 | $115 | 39 |
Match score weights: distance 35% · size 25% · config 20% · recency 20%. Top-matched comps best support the ARV.
Projected returns pro-forma
-3.0% appreciation · 2.57% rent growth · sell at horizon
- IRR
- -9.3%
- Equity multiple
- 0.66×
- Total profit
- $-50,900
- Equity at exit
- $79,770
- IRR
- -0.4%
- Equity multiple
- 0.97×
- Total profit
- $-4,503
- Equity at exit
- $46,257
Cash invested: $149,800 (down + closing). Projections, not guarantees.
Landlord ↔ Tenant lean methodology
- Overall (STATE)
- 87 Strongly Landlord-Friendly
- State Texas
- 87 Strongly Landlord-Friendly · R+5
- County
- — inherits STATE
- City
- — inherits STATE
ZIP-level market 78504
- Home prices YoY
- -29.4%
- Rents YoY
- 2.6%
- Active inventory
- 888
- Price-to-rent
- 31.3×
Monthly cashflow live
- Estimated rent
- $5,516 high interval (Pro) →
- Mortgage (P&I)
- −$2,806
- Tax est. 1.5%
- −$669 /mo · $8,025/yr
- Insurance
- −$223
- HOA
- −$63
- Vacancy / Maint / Mgmt
- −$1,158
- Net cashflow
- $597
Break-even live
4-unit breakdown (identical units grouped — click to expand)
| Units | Beds | Baths | Est. rent |
|---|---|---|---|
| 2× units | 3 | 2 | $2,846 |
| #1 | 3 | 2 | $1,423 |
| #2 | 3 | 2 | $1,423 |
| 2× units | 2 | 2 | $2,670 |
| #3 | 2 | 2 | $1,335 |
| #4 | 2 | 2 | $1,335 |
| Total (4 units) | $5,516 | ||
UW: 25.0% down · 7.5% · 30yr · 1.5% tax · 5.0% vac · 8.0% maint · 8.0% mgmt
Financing live
Cash to close
- Down payment
- $133,750
- Closing costs
- $16,050
- Reserves months
- —
- Total cash needed
- —
Loan-product check · same deal, 3 products live
Conventional
25% down · 7.5% · 30yr
- Down + closing
- —
- Monthly P&I
- —
- Monthly cashflow
- —
- DSCR
- —
- Eligible?
- —
Personal DTI + credit; lowest rate.
DSCR
20% down · 8.5% · 30yr
- Down + closing
- —
- Monthly P&I
- —
- Monthly cashflow
- —
- DSCR
- —
- Eligible?
- —
No personal income docs; deal must DSCR.
Hard money
10% down · 12.0% · 12mo
- Down + closing
- —
- Monthly P&I
- —
- Monthly cashflow
- —
- DSCR
- —
- Eligible?
- —
Short-term bridge; refi at stabilization.
Rent comps 10 comps
| Address | Beds | Baths | Sqft | Rent | $/sqft | DOM | Units | Dist |
|---|---|---|---|---|---|---|---|---|
| 2104 E Viviana St Unit 3 Edinburg, TX | 3.0 | 2.0 | 3844 | $1,475 | $0.38 | 44d | 1 | 0.02mi |
| 2104 E Viviana St Unit 2 Edinburg, TX | 2.0 | 2.0 | 3844 | $1,300 | $0.34 | 23d | 1 | 0.04mi |
| 2108 E San Andrea St Unit 1 Edinburg, TX | 2.0 | 2.0 | 3838 | $1,100 | $0.29 | 14d | 1 | 0.07mi |
| 2132 E Wisconsin Rd Edinburg, TX | 1.0 | 1.0 | 4308 | $756 | $0.18 | 44d | 1 | 0.22mi |
| 2905 Javalina Ave Unit 1 Edinburg, TX | 2.0 | 2.0 | 4232 | $1,100 | $0.26 | 44d | 1 | 0.55mi |
| 2913 Linda Vista St Unit C Edinburg, TX | 2.0 | 2.0 | 3740 | $925 | $0.25 | 23d | 1 | 0.59mi |
| 3003 Linda Vista St Unit 2 Edinburg, TX | 2.0 | 1.0 | 3808 | $1,100 | $0.29 | 14d | 1 | 0.61mi |
| 2120 Taxco Ct Unit 3 Edinburg, TX | 3.0 | 2.0 | 4256 | $1,200 | $0.28 | 23d | 1 | 0.65mi |
| 2120 Taxco Ct Unit 4 Edinburg, TX | 2.0 | 2.0 | 4256 | $1,000 | $0.23 | 21d | 1 | 0.65mi |
| 2204 Taxco Ct Unit 3 Edinburg, TX | 3.0 | 2.0 | 4256 | $1,200 | $0.28 | 44d | 1 | 0.65mi |
HOA detail
- Monthly dues
- $63 · $756/yr
Listing history 11 events
-
2026-06-07statusdays on market $535,000 Pending 53 DOM
-
2026-06-03days on market $535,000 Active 51 DOM
-
2026-06-02days on market $535,000 Active 50 DOM
-
2026-06-01days on market $535,000 Active 49 DOM
-
2026-05-31days on market $535,000 Active 48 DOM
-
2026-05-31days on market $535,000 Active 47 DOM
-
2026-04-09$535,000 Active 1005-char remark
Show marketing remark (1005 chars)
New construction fourplex in Edinburg, TX—an excellent opportunity for investors looking to grow their portfolio! Ideally situated in a prime location, this property offers easy access to major roadways, shopping centers, grocery stores, restaurants, and a wide range of everyday conveniences. Each unit is thoughtfully designed with modern finishes and stylish fixtures, creating an attractive and comfortable living space for future tenants. The layout includes two units featuring 3 bedrooms and 2 bathrooms, along with two additional units offering 2 bedrooms and 2 bathrooms. 3 of 4 units are currently leased at $3,950/month. Unit #4 is vacant and is offered at $1,250/month. Total gross would be $5,200. With its desirable location, well-designed floor plans, and contemporary appeal, this fourplex presents strong potential for consistent rental income. Opportunities like this in Edinburg are rare—don’t miss your chance to invest in a high-demand property with long-term value.
-
2026-03-17status Pending
-
2026-03-08historical Option
-
2025-04-11$538,000 Active
-
2025-04-01$525,000 Active
ⓘ Source: listings_history table (triggers on properties + properties_extension) + one-shot
backfill from property_details.listing_events for pre-trigger history.
Nearby sold comps map
Loading sold comps map…
Walkable amenities ~0.75 mi
Loading nearby amenities…
Taxation est. · year 1
- Rental income
- $66,192
- − Mortgage interest
- −$29,968
- − Property taxes
- −$8,025
- − Insurance
- −$2,675
- − Repairs & maintenance
- −$5,295
- − Management
- −$5,295
- − HOA
- −$756
- − Depreciation
- −$15,564
- Taxable loss
- −$1,387
- Est. tax savings @ 24.0%
- +$333
- After-tax cash flow
- $7,501/yr
For passive investors: Depreciation is non-cash, so a rental often shows a tax loss while cash-flowing — sheltering income. Rental losses are passive: they offset passive income freely, and up to $25,000/yr can offset ordinary (W-2) income if you actively participate and your MAGI is under $100k (phasing out to $0 by $150k); unused losses carry forward. On sale, claimed depreciation is recaptured at up to 25%, and gains may owe capital-gains tax (a 1031 exchange can defer both). Figures are a year-1 estimate at your 24.0% rate — not tax advice; consult a CPA.
Condition & rehab AI · 12 photos
This fourplex in Edinburg, TX is in excellent condition with modern finishes and a prime location. It is move-in ready and offers a great opportunity for investors looking to grow their portfolio.
Value-add opportunities
- Both Landscaping and curb appeal improvements — Enhances curb appeal and can attract more tenants.
- Both Addition of smart home features — Improves convenience and can attract tech-savvy tenants.
- Both Update lighting fixtures — Modernizes the space and can improve energy efficiency.
Renovation cost estimate screening
Value-add ROI direction
- Both Landscaping and curb appeal improvements — Enhances curb appeal and can attract more tenants. ↑
- Both Addition of smart home features — Improves convenience and can attract tech-savvy tenants. ↑
- Both Update lighting fixtures — Modernizes the space and can improve energy efficiency. ↑
ⓘ Cost ranges are severity-bucket heuristics (US national rule-of-thumb). Get contractor quotes + a written scope before underwriting a rehab budget.
Schools (NCES district)
- District
- Edinburg CISD
- NCES district ID
- 4818180
- Math proficiency
- 20% ▼ -34.00%
- Reading proficiency
- 34% ▼ -11.00%
- Median HH income
- $36,985
- Composite
- 22.42/100
- National rank
- #8114
- State rank
- #699 of 826 in TX
Livability — Edinburg
- Score
- 64/100
- State rank
- #784
- US rank
- #14319
Category grades
Schools grade is shown separately in the Schools card above.
Census & demographics
- Census place
- Edinburg, TX
- County
- Hidalgo County · 623,128 people
- City population
- 178,279
- Metro
- McAllen-Edinburg-Mission, TX
- Population (ZIP)
- 63,094
- Household income
- $81,905
- Rent vs Own
- Severe rent burden
- 1468.0
Population outlook (Hidalgo County) Hauer SSP2
- Today (2025)
- 955,232 people
- By 2030
- 1,009,774 · +5.7%
- By 2040
- 1,120,332 · +17.3%
- By 2050
- 1,225,036 · +28.2%
- By 2075
- 1,439,189 · +50.7%
- By 2100
- 1,533,429 · +60.5%
Race, ethnicity, and origin ACS 2023
- Neighborhood character
- Predominantly Hispanic (82%)
- Race & ethnicity
- Hispanic / Latino 82% Two or more races 39% White 11% Asian 5%
- Hispanic origin (detail)
- Mexican 75%
- Common ancestry
- Lithuanian 1% Italian 1%
- Foreign-born
- 24% · Canada, South Korea, Vietnam
- Languages at home
- 34% English-only · Spanish 62% Other Asian/Pacific 1% Tagalog/Filipino 1%
Political lean MEDSL · Hidalgo
- 2024 margin
- Toss-up / Even · D 48.1% · R 51.0%
- 2008→2024 swing
- -41.6pp toward R · 2008: 38.7pp · 2024: -2.9pp
- All cycles
- 2024: R+2.9 2020: D+17.1 2016: D+40.5 2012: D+41.8 2008: D+38.7
Not yet ingested
- Civics
- —
Market trends
- HPI YoY
- ▼ -80.87%
- Current HPI
- 194.1764
- Rent YoY
- ▲ 2.57%
- Metro
- McAllen-Edinburg-Mission, TX
- State GDP YoY
- ▲ 3.95%
- F500 in state
- 110
Industry mix (Fortune 500 HQ in TX)
| Industry | F500 HQs | Revenue |
|---|---|---|
| Energy | 16 | $1,198B |
|
||
| Technology | 5 | $198B |
|
||
| Engineering / Construction | 4 | $72B |
|
||
| Energy Services | 3 | $60B |
|
||
| Utilities | 3 | $41B |
|
||
| Healthcare | 2 | $330B |
|
||
Price history
+1.9% since first listed5 events — show timeline
- 2026-04-09 Listed $535,000 MCALLENMLS
- 2026-03-17 Pending — MCALLENMLS
- 2026-03-08 Contingent — MCALLENMLS
- 2025-04-11 Listed $538,000 MCALLENMLS
- 2025-04-01 Listed $525,000 MCALLENMLS
Cash-flow waterfall
monthlySold comps — $/sqft
last 12 mo · ≤1 miLoading sold comps…