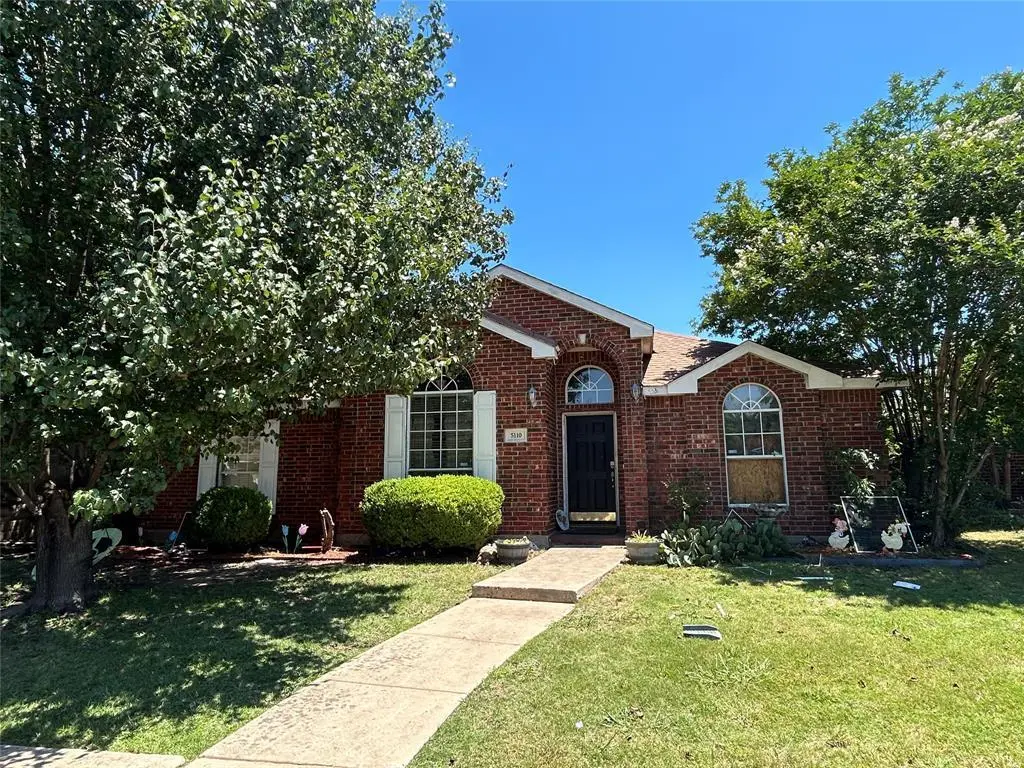
5110 Summertree Ct
Garland, TX 75043
$219,900D+
4 bd · 2.0 ba ·
2,086 sqft ·
Built 2001
· SingleFamily
· Active
· 27 DOM
Cashflow @ list (25.0% down · 7.5%)
Estimated rent
$2,445/mo
Mortgage (P&I)
−$1,153
Tax + insurance
−$834
HOA
−$23
Vac / Maint / Mgmt
−$514
Net cashflow
$-78/mo
Annual
$-937/yr
Cap rate
5.87%
Cash-on-cash
-1.52%
DSCR
0.93
1% rule
1.11%
Cash to close
$61,572
Investor read
- This is a 4-bed/2.0-bath single-family listed at $220k.
- At list price, monthly cash flow is $-78 ($-937/yr) — negative.
- To cash-flow at today's rent, offer at most $206k (6.3% below list).
- Meets the 1% rule at list price ($2k rent vs $220k).
- It's been on market 27 days — a 2% lower offer ($217k) is reasonable based on typical stale-listing flexibility.
- Recommended offer: $206k (6.3% below list) — sets the bar for cash-flow.
- Local home prices are declining (-3.0%/yr); year-one equity from $2k of loan paydown is wiped out by about $7k of value loss. Plan a longer hold.
- Location reads 74/100 on livability (#165 in TX, #4,447 nationally) — a middle-class / working-renter tenant base. Strengths: commute A+, housing A+, cost of living A-; Watch: amenities C-, schools D+, health & safety F.
- Garland ISD (suburban): math 27% / reading 37% proficiency, ranked #553 of 826 in TX (top 67%) — families likely to look elsewhere, expect single-tenant / working-renter base with shorter leases.
- Watch-outs: property tax is 4.0% of price.
- Market conditions: Rents flat; 361 active listings in the ZIP; 40 comparable units currently listed for rent nearby; rentals at typical pace (median 25d on market — plan ~3-4 weeks tenant-placement turnaround); solid renter incomes; 12,577 units permitted in Dallas County in 2024 (6,829 in 5+ unit buildings).
- Dallas County population projected at +35% by 2050 — long-run rental-demand tailwind backs the buy-and-hold thesis.
- 3 sale attempts since 24y ago with the ask held roughly flat each time — persistent listings suggest the price (not the market) is what's stuck; bring a comps-based counter.
- Climate carrying-cost: major wind risk, 27% chance of damaging wind over 30y; extreme-heat days projected 7→24/yr by 2055 (HVAC capex compounding) — expect insurance premiums to compound above CPI over the hold.
- Cap rate 5.9% vs local median 3.5% in Garland — top-decile yield for the area; either an underpriced asset or a hidden risk that comps aren't pricing in. Stress-test before assuming the spread holds.
- This rent runs 38% of the median local income ($77k/yr) — at the standard rent-burdened threshold; future hikes will face affordability resistance.
Questions for listing agent
- What do current leases actually rent for vs. the listed asking? Can we see a recent rent roll and the last 12 months of T-12 income?
- Property tax is high relative to price — has the assessment been appealed recently, and will the sale trigger a re-assessment?
- What does the HOA fee cover, when was the last increase, and are there any pending special assessments or reserve-fund shortfalls?
- Is there a deadline driving the sale (1031 exchange, divorce, estate, relocation)? That informs how much negotiation room exists.
- Schools are D-rated, which usually means shorter tenancies and higher turnover. Who's the typical renter profile here, and what's been the actual vacancy rate?
- The area grade is low — what's the realistic commute time and amenity access for the typical tenant pool here? Any planned neighborhood developments (good or bad) we should know about?
- What's the average days-on-market for RENTAL listings here right now (not sales)? A rising rental-DOM trend means longer vacancies and softer asking-rent achievability than the comps imply.
- What's the recent tenant-quality profile in this submarket — average credit score on applications, eviction rate, late-payment / NSF rate, and stable-employment percentage? A property-management company in the area should have these aggregated.
CashFlowRE · CFR-CSDY5W35QQ3680
· Data 2 weeks ago
cashflowre.app · 2026-05-29