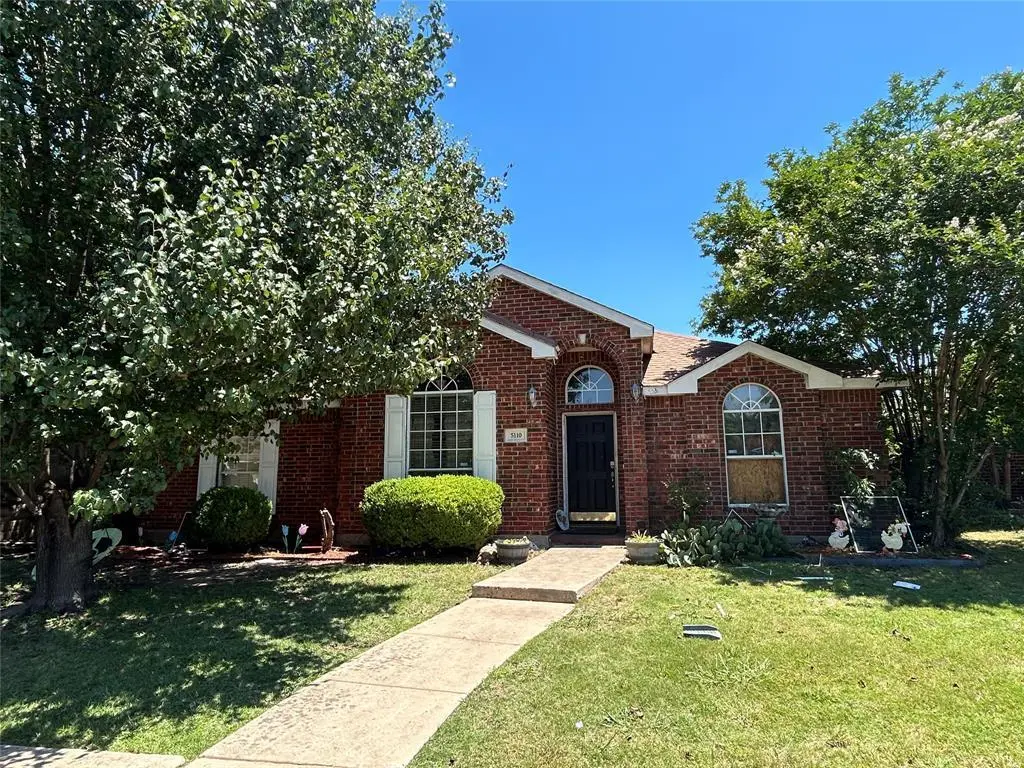
5110 Summertree Ct · Garland, TX
Flood risk 1/10 · Minimal
- FEMA flood zone
- X (unshaded)
- Chance of flooding over 30 yrs
- 0.0%
- Est. flood insurance / yr
- $507 – $1,088
Fire risk 2/10 · Minimal
- Est. fire insurance / yr
- $1,222 – $2,270
Heat risk 8/10 · Major
- Hot days now (above 110°F)
- 7 days/yr
- Hot days in 30 yrs
- 24 days/yr
Wind risk 6/10 · Moderate
- Chance of severe wind over 30 yrs
- 27.0%
Air-quality risk 2/10 · Minimal
- Unhealthy air days now
- 2 days/yr
- Unhealthy air days in 30 yrs
- 2 days/yr
Risk factors via First Street. Map © Google.
Why this score? — see what drove the D+ grade
The composite is a weighted blend of 9 inputs, each scored 0–100. Each bar is that input's sub-score; the figure is the points it added to the 100-point composite (weight × sub-score).
- ARV discount +15.0/15.0
- Cash flow +11.4/30.0
- 1% rule +6.1/10.0
- Livability +3.7/5.0
- DSCR +3.3/10.0
- Schools +2.9/10.0
- Rent growth +2.6/5.0
- Condition / age +2.5/5.0
- Appreciation +0.0/10.0
$219,900
🖨 Deal sheet 📄 Offer letter ✓ Due diligence
Listing remarks
Investor special in the heart of Garland! This 4-bedroom, 2-bath home offers a spacious layout with two living areas and an open-concept design, providing a solid foundation for a full renovation project. The property has sustained fire damage and is being sold as-is. The home will require complete interior clean-out, including removal of all contents, followed by a full rehab. Ideal for experienced investors or contractors looking for their next project with strong upside potential. With its functional floor plan, generous square footage, and desirable layout, this property presents an excellent opportunity to reimagine and rebuild to modern standards. Buyer to verify all information. No r
Key facts
- 7,100 sq ft lot
- 2 garage spots
- Built 2001
Property features AI
Finance
- HOA & community: Annual association fee of $280 (management fees included); No association (Association type listed as None)
Exterior
- Parking: Attached 2-car garage; 2 covered parking spaces; Alley access
- Utilities: City water; City sewer; Cable available; Concrete curbs and sidewalks; Alley access; Located in a municipal utility district
- Home design: Single-family residence; One story; Residential property
- Construction: Built in 2001; Brick and wood construction; Composition roof; Slab foundation
- Exterior features: Covered porch(es); Covered patio/porch; Private yard; Wood fencing; Interior lot on a cul-de-sac
Interior
- Kitchen: Kitchen with breakfast bar; Built-in cabinets; Kitchen island
- Bedrooms: 4 bedrooms on the main level
- Flooring: Ceramic tile flooring
- Bathrooms: 2 full bathrooms
- Heating & cooling: Central heating; Central electric air conditioning; Ceiling fans
- Interior features: Open floorplan; Two living areas; One dining area; Total of 10 rooms; Fireplace in living area; Ensuite bath and walk-in closet in primary bedroom; Built-in cabinets in primary bathroom
- Laundry & utility: Washer hookup; Electric dryer hookup; Utility room
Neighborhood map
What this means for you Summary
Snapshot
- This is a 4-bed/2.0-bath single-family listed at $220k.
Deal economics
- At list price, monthly cash flow is $-78 ($-937/yr) — negative.
- To cash-flow at today's rent, offer at most $206k (6.3% below list).
- Meets the 1% rule at list price ($2k rent vs $220k).
- Recommended offer: $206k (6.3% below list) — sets the bar for cash-flow.
- Cap rate 5.9% vs local median 3.5% in Garland — top-decile yield for the area; either an underpriced asset or a hidden risk that comps aren't pricing in. Stress-test before assuming the spread holds.
Location & tenants
- Location reads 74/100 on livability (#165 in TX, #4,447 nationally) — a middle-class / working-renter tenant base. Strengths: commute A+, housing A+, cost of living A-; Watch: amenities C-, schools D+, health & safety F.
- Garland ISD (suburban): math 27% / reading 37% proficiency, ranked #553 of 826 in TX (top 67%) — families likely to look elsewhere, expect single-tenant / working-renter base with shorter leases.
- Market conditions: Rents flat; 361 active listings in the ZIP; 40 comparable units currently listed for rent nearby; rentals at typical pace (median 25d on market — plan ~3-4 weeks tenant-placement turnaround); solid renter incomes; 12,577 units permitted in Dallas County in 2024 (6,829 in 5+ unit buildings).
- This rent runs 38% of the median local income ($77k/yr) — at the standard rent-burdened threshold; future hikes will face affordability resistance.
Forward outlook
- Local home prices are declining (-3.0%/yr); year-one equity from $2k of loan paydown is wiped out by about $7k of value loss. Plan a longer hold.
- Dallas County population projected at +35% by 2050 — long-run rental-demand tailwind backs the buy-and-hold thesis.
Negotiation context
- It's been on market 27 days — a 2% lower offer ($217k) is reasonable based on typical stale-listing flexibility.
- 3 sale attempts since 24y ago with the ask held roughly flat each time — persistent listings suggest the price (not the market) is what's stuck; bring a comps-based counter.
Risks & watch-outs
- Watch-outs: property tax is 4.0% of price.
- Climate carrying-cost: major wind risk, 27% chance of damaging wind over 30y; extreme-heat days projected 7→24/yr by 2055 (HVAC capex compounding) — expect insurance premiums to compound above CPI over the hold.
Questions for the listing agent
- What do current leases actually rent for vs. the listed asking? Can we see a recent rent roll and the last 12 months of T-12 income?
- Property tax is high relative to price — has the assessment been appealed recently, and will the sale trigger a re-assessment?
- What does the HOA fee cover, when was the last increase, and are there any pending special assessments or reserve-fund shortfalls?
- Is there a deadline driving the sale (1031 exchange, divorce, estate, relocation)? That informs how much negotiation room exists.
- Schools are D-rated, which usually means shorter tenancies and higher turnover. Who's the typical renter profile here, and what's been the actual vacancy rate?
- The area grade is low — what's the realistic commute time and amenity access for the typical tenant pool here? Any planned neighborhood developments (good or bad) we should know about?
- What's the average days-on-market for RENTAL listings here right now (not sales)? A rising rental-DOM trend means longer vacancies and softer asking-rent achievability than the comps imply.
- What's the recent tenant-quality profile in this submarket — average credit score on applications, eviction rate, late-payment / NSF rate, and stable-employment percentage? A property-management company in the area should have these aggregated.
- How much new for-sale + rental construction is in the pipeline within 1–3 miles? Heavy new supply typically softens prices + rents 12–24 months out; constrained supply supports both.
Investment metrics
- 1% rule
- 1.11% ✓
- Cap rate
- 5.87%
- Cash-on-cash
- -1.52%
- DSCR
- 0.93
- GRM
- 7.5
CMA / ARV
- ARV (on-the-fly)
- $329,588
- Comps found
- 12
Show comp detail 12 sales within ~0.75 mi
| Address | Dist | Beds/Ba | Sqft | Sold | Price | $/sf | Match |
|---|---|---|---|---|---|---|---|
| 5225 Pensacola Dr | 0.16mi | 4/2.0 | 1,968 (-6%) | 0mo | $310,000 | $158 | 83 |
| 1818 Knob Hill Dr | 0.45mi | 4/2.0 | 1,948 (-7%) | 2mo | $299,900 | $154 | 67 |
| 1322 David Dr | 0.30mi | 3/2.0 (-1) | 1,888 (-10%) | 2mo | $149,990 | $79 | 64 |
| 934 Meadowdale Cir | 0.61mi | 4/2.0 | 2,000 (-4%) | 4mo | $315,000 | $158 | 61 |
| 1022 Mayapple Dr | 0.64mi | 3/2.0 (-1) | 2,185 (+5%) | 3mo | $385,000 | $176 | 55 |
| 8305 Hunsaker Ln | 0.72mi | 4/3.0 | 2,060 (-1%) | 7mo | $447,965 | $217 | 54 |
| 1405 Buena Vista Ave | 0.39mi | 3/2.0 (-1) | 1,833 (-12%) | 4mo | $340,000 | $185 | 53 |
| 3509 Shoreside Dr | 0.48mi | 3/2.0 (-1) | 1,905 (-9%) | 6mo | $360,000 | $189 | 53 |
| 4805 S Country Club Rd | 0.52mi | 3/2.0 (-1) | 1,875 (-10%) | 3mo | $288,000 | $154 | 51 |
| 926 Meadowcove Cir | 0.63mi | 4/2.0 | 1,785 (-14%) | 5mo | $269,900 | $151 | 43 |
| 960 Meadowcove Cir | 0.73mi | 3/2.0 (-1) | 1,871 (-10%) | 2mo | $235,000 | $126 | 42 |
| 7057 Birdwatch Dr | 0.72mi | 4/3.0 | 2,322 (+11%) | 3mo | $457,740 | $197 | 41 |
Match score weights: distance 35% · size 25% · config 20% · recency 20%. Top-matched comps best support the ARV.
Projected returns pro-forma
-3.0% appreciation · 0.47% rent growth · sell at horizon
- IRR
- -22.5%
- Equity multiple
- 0.25×
- Total profit
- $-46,338
- Equity at exit
- $32,788
- IRR
- -28.4%
- Equity multiple
- -0.12×
- Total profit
- $-69,060
- Equity at exit
- $19,013
Cash invested: $61,572 (down + closing). Projections, not guarantees.
Landlord ↔ Tenant lean methodology
- Overall (STATE)
- 87 Strongly Landlord-Friendly
- State Texas
- 87 Strongly Landlord-Friendly · R+5
- County
- — inherits STATE
- City
- — inherits STATE
ZIP-level market 75043
- Home prices YoY
- -33.4%
- Rents YoY
- 0.5%
- Active inventory
- 361
- Price-to-rent
- 7.5×
Monthly cashflow live
- Estimated rent
- $2,445 high interval (Pro) →
- Mortgage (P&I)
- −$1,153
- Tax from tax record
- −$742 /mo · $8,904/yr
- Insurance
- −$92
- HOA
- −$23
- Vacancy / Maint / Mgmt
- −$514
- Net cashflow
- $-78
Break-even live
UW: 25.0% down · 7.5% · 30yr · 1.5% tax · 5.0% vac · 8.0% maint · 8.0% mgmt
Financing live
Cash to close
- Down payment
- $54,975
- Closing costs
- $6,597
- Reserves months
- —
- Total cash needed
- —
Loan-product check · same deal, 3 products live
Conventional
25% down · 7.5% · 30yr
- Down + closing
- —
- Monthly P&I
- —
- Monthly cashflow
- —
- DSCR
- —
- Eligible?
- —
Personal DTI + credit; lowest rate.
DSCR
20% down · 8.5% · 30yr
- Down + closing
- —
- Monthly P&I
- —
- Monthly cashflow
- —
- DSCR
- —
- Eligible?
- —
No personal income docs; deal must DSCR.
Hard money
10% down · 12.0% · 12mo
- Down + closing
- —
- Monthly P&I
- —
- Monthly cashflow
- —
- DSCR
- —
- Eligible?
- —
Short-term bridge; refi at stabilization.
Rent comps 40 comps
| Address | Beds | Baths | Sqft | Rent | $/sqft | DOM | Units | Dist |
|---|---|---|---|---|---|---|---|---|
| 3205 Hamlett Ln Garland, TX | 4.0 | 2.0 | 2184 | $2,850 | $1.30 | 2d | 1 | 0.10mi |
| 3043 Songbird Ln Garland, TX | 3.0 | 2.5 | 1777 | $2,459 | $1.38 | 24d | 1 | 0.29mi |
| 3039 Songbird Ln Garland, TX | 3.0 | 2.5 | 1603 | $2,419 | $1.51 | 17d | 1 | 0.29mi |
| 5412 Granite Trl Garland, TX | 3.0 | 2.5 | 1777 | $2,539 | $1.43 | 8d | 1 | 0.29mi |
| 3027 Songbird Ln Garland, TX | 3.0 | 2.5 | 1777 | $2,529 | $1.42 | 44d | 1 | 0.30mi |
| 5416 Granite Trl Garland, TX | 3.0 | 2.5 | 1603 | $2,399 | $1.50 | 24d | 1 | 0.30mi |
| 3035 Songbird Ln Garland, TX | 3.0 | 2.5 | 1836 | $2,679 | $1.46 | 22d | 1 | 0.30mi |
| 3027 Songbird Ln Garland, TX | 3.0 | 2.5 | 1777 | $2,499 | $1.41 | 8d | 1 | 0.30mi |
| 3023 Songbird Ln Garland, TX | 3.0 | 2.5 | 1603 | $2,449 | $1.53 | 8d | 1 | 0.30mi |
| 5420 Granite Trl Garland, TX | 3.0 | 2.5 | 1836 | $2,679 | $1.46 | 17d | 1 | 0.30mi |
| 3019 Songbird Ln Garland, TX | 3.0 | 2.5 | 1836 | $2,649 | $1.44 | 8d | 1 | 0.31mi |
| 3020 Songbird Ln Garland, TX | 3.0 | 2.5 | 1777 | $2,539 | $1.43 | 8d | 1 | 0.32mi |
| 3040 Songbird Ln Garland, TX | 3.0 | 2.5 | 1777 | $2,529 | $1.42 | 44d | 1 | 0.32mi |
| 3040 Songbird Ln Garland, TX | 3.0 | 2.5 | 1777 | $2,499 | $1.41 | 24d | 1 | 0.32mi |
| 5436 Granite Trl Garland, TX | 3.0 | 2.5 | 1603 | $2,399 | $1.50 | 44d | 1 | 0.32mi |
| 3024 Songbird Ln Garland, TX | 3.0 | 2.5 | 1603 | $2,399 | $1.50 | 24d | 1 | 0.33mi |
| 5412 Sandstone Dr Garland, TX | 3.0 | 2.5 | 1603 | $2,399 | $1.50 | 44d | 1 | 0.34mi |
| 4909 Van Ness St Garland, TX | 3.0 | 2.0 | 1944 | $2,395 | $1.23 | 8d | 1 | 0.40mi |
| 5464 Sandstone Dr Garland, TX | 3.0 | 2.5 | 1603 | $2,459 | $1.53 | 3d | 1 | 0.40mi |
| 4909 Van Ness St Garland, TX | 3.0 | 2.0 | 1944 | $2,500 | $1.29 | 44d | 1 | 0.40mi |
| 1910 Lombard St Garland, TX | 4.0 | 3.0 | 1926 | $2,150 | $1.12 | 4d | 1 | 0.45mi |
| 1934 Geary St Garland, TX | 4.0 | 2.5 | 2279 | $2,390 | $1.05 | 8d | 1 | 0.46mi |
| 1934 Geary St Garland, TX | 4.0 | 2.5 | 2279 | $2,390 | $1.05 | 24d | 1 | 0.46mi |
| 5201 Waltham Ct Garland, TX | 3.0 | 2.5 | 2012 | $1,250 | $0.62 | 22d | 1 | 0.51mi |
| 5200 Waltham Ct Garland, TX | 3.0 | 2.5 | 2019 | $1,200 | $0.59 | 13d | 1 | 0.53mi |
| 3806 Whiterock Trl Garland, TX | 3.0 | 2.0 | 1991 | $2,400 | $1.21 | 24d | 1 | 0.65mi |
| 5305 Meadowside Dr Garland, TX | 3.0 | 2.0 | 1575 | $1,950 | $1.24 | 44d | 1 | 0.72mi |
| 5206 Wolverton Ct Garland, TX | 3.0 | 2.5 | 1503 | $1,925 | $1.28 | 24d | 1 | 0.72mi |
| 4106 Carrington Dr Garland, TX | 4.0 | 2.0 | 2610 | $2,600 | $1.00 | 44d | 1 | 0.74mi |
| 4805 Prairie Aster Dr Garland, TX | 4.0 | 3.0 | 2559 | $3,200 | $1.25 | 1d | 1 | 0.75mi |
| 3921 Whiterock Trl Garland, TX | 3.0 | 2.0 | 2110 | $2,300 | $1.09 | 44d | 1 | 0.79mi |
| 4245 Bobtown Rd Garland, TX | 1.0–3.0 | 1.0–2.0 | 1035 | $2,845 | $2.75 | 1d | 24 | 0.81mi |
| 718 Maple Glen Dr Garland, TX | 3.0 | 2.0 | 1695 | $2,200 | $1.30 | 44d | 1 | 0.83mi |
| 1022 Wendell Way Garland, TX | 3.0 | 2.0 | 1500 | $1,995 | $1.33 | 44d | 1 | 0.87mi |
| 3730 Balsam Fir Dr Garland, TX | 4.0 | 3.0 | 2346 | $2,495 | $1.06 | 21d | 1 | 0.92mi |
| 741 Creekwater Ln Garland, TX | 4.0 | 3.0 | 2200 | $2,995 | $1.36 | 1d | 1 | 0.92mi |
| 741 Creekwater Ln Garland, TX | 4.0 | 3.0 | 2152 | $2,999 | $1.39 | 24d | 1 | 0.92mi |
| 5509 Kerry Ln Garland, TX | 3.0 | 2.0 | 1630 | $2,100 | $1.29 | 44d | 1 | 1.02mi |
| 2922 Clover Valley Dr Garland, TX | 4.0 | 2.0 | 1934 | $6,950 | $3.59 | 1d | 1 | 1.02mi |
| 2922 Clover Valley Dr Unit 1019472P Garland, TX | 4.0 | 2.0 | 1926 | $14,000 | $7.27 | 24d | 1 | 1.02mi |
HOA detail
- Monthly dues
- $23 · $276/yr
Listing history 13 events
-
2026-06-07days on market $219,900 Active 27 DOM
-
2026-06-04days on market $219,900 Active 24 DOM
-
2026-06-03days on market $219,900 Active 23 DOM
-
2026-06-02days on market $219,900 Active 22 DOM
-
2026-06-01days on market $219,900 Active 21 DOM
-
2026-05-31days on market $219,900 Active 20 DOM
-
2026-05-11$219,900 Active
-
2010-01-04soldstatus
-
2009-12-22$165,000
-
2009-12-22historical
-
2003-02-13soldstatus
-
2003-01-09historical
-
2002-10-29$167,000
ⓘ Source: listings_history table (triggers on properties + properties_extension) + one-shot
backfill from property_details.listing_events for pre-trigger history.
Tax reassessment forecast TX · Resets to sale price
- Current annual tax
- $8,904 · $742/mo
- Projected year-2 tax
- $8,904 · $742/mo
- Expected delta
- $0/yr ($0/mo · 0.0%)
ⓘ Screening estimate from a state-policy table — verify with the county assessor before closing.
Climate risk First Street
- Flood 1/10 Low FEMA zone X (unshaded) · 0% chance over 30 yrs
- Wildfire 2/10 Low
- Heat 8/10 Severe 7 d/yr ≥110°F today · 24 d/yr by 30 yrs out
- Wind 6/10 Major 27% chance of damaging wind over 30 yrs
- Air quality 2/10 Low 2 unhealthy d/yr today · 2 by 30 yrs out
Nearby sold comps map
Loading sold comps map…
Walkable amenities ~0.75 mi
Loading nearby amenities…
Taxation est. · year 1
- Rental income
- $29,343
- − Mortgage interest
- −$12,318
- − Property taxes
- −$8,904
- − Insurance
- −$1,100
- − Repairs & maintenance
- −$2,347
- − Management
- −$2,347
- − HOA
- −$276
- − Depreciation
- −$6,397
- Taxable loss
- −$4,346
- Est. tax savings @ 24.0%
- +$1,043
- After-tax cash flow
- $106/yr
For passive investors: Depreciation is non-cash, so a rental often shows a tax loss while cash-flowing — sheltering income. Rental losses are passive: they offset passive income freely, and up to $25,000/yr can offset ordinary (W-2) income if you actively participate and your MAGI is under $100k (phasing out to $0 by $150k); unused losses carry forward. On sale, claimed depreciation is recaptured at up to 25%, and gains may owe capital-gains tax (a 1031 exchange can defer both). Figures are a year-1 estimate at your 24.0% rate — not tax advice; consult a CPA.
Schools (NCES district)
- District
- Garland ISD
- NCES district ID
- 4820340
- Math proficiency
- 27% ▼ -23.00%
- Reading proficiency
- 37% ▼ -10.00%
- Median HH income
- $58,392
- Composite
- 28.63/100
- National rank
- #6706
- State rank
- #553 of 826 in TX
Livability — Garland
- Score
- 74/100
- State rank
- #165
- US rank
- #4447
Category grades
Schools grade is shown separately in the Schools card above.
Census & demographics
- Census place
- Garland, TX
- County
- Dallas County · 2,612,404 people
- City population
- 246,342
- Metro
- Dallas-Fort Worth-Arlington, TX
- Population (ZIP)
- 63,152
- Household income
- $76,778
- Rent vs Own
- Severe rent burden
- 2275.0
Population outlook (Dallas County) Hauer SSP2
- Today (2025)
- 2,979,839 people
- By 2030
- 3,191,823 · +7.1%
- By 2040
- 3,619,611 · +21.5%
- By 2050
- 4,026,915 · +35.1%
- By 2075
- 4,957,073 · +66.4%
- By 2100
- 5,508,725 · +84.9%
Race, ethnicity, and origin ACS 2023
- Neighborhood character
- Highly diverse neighborhood (Simpson 0.73)
- Race & ethnicity
- Hispanic / Latino 37% White 30% Two or more races 23% Black 21% Asian 8%
- Hispanic origin (detail)
- Mexican 29%
- Common ancestry
- Slovak 1% Portuguese 1% Lithuanian 1%
- Foreign-born
- 24% · Canada, Vietnam
- Languages at home
- 60% English-only · Spanish 31% Other Asian/Pacific 2% Vietnamese 2%
Political lean MEDSL · Dallas
- 2024 margin
- Strong D (+22.2) · D 60.2% · R 38.0% · Other 1.8%
- 2008→2024 swing
- +6.9pp toward D · 2008: 15.3pp · 2024: 22.2pp
- All cycles
- 2024: D+22.2 2020: D+31.6 2016: D+26.2 2012: D+15.4 2008: D+15.3
Not yet ingested
- Civics
- —
Market trends
- HPI YoY
- ▼ -148.30%
- Current HPI
- 295.5641
- Rent YoY
- ▲ 0.47%
- Metro
- Dallas-Fort Worth-Arlington, TX
- State GDP YoY
- ▲ 3.95%
- F500 in state
- 110
Industry mix (Fortune 500 HQ in TX)
| Industry | F500 HQs | Revenue |
|---|---|---|
| Energy | 16 | $1,198B |
|
||
| Technology | 5 | $198B |
|
||
| Engineering / Construction | 4 | $72B |
|
||
| Energy Services | 3 | $60B |
|
||
| Utilities | 3 | $41B |
|
||
| Healthcare | 2 | $330B |
|
||
Price history
+31.7% since first listed7 events — show timeline
- 2026-05-11 Listed $219,900 NTREIS
- 2010-01-04 Sold (Public Records) — Public Records
- 2009-12-22 Listing Removed — NTREIS
- 2009-12-22 Listed $165,000 NTREIS
- 2003-02-13 Sold (Public Records) — Public Records
- 2003-01-09 Listing Removed — NTREIS
- 2002-10-29 Listed $167,000 NTREIS
Property tax history
+4.5%/yrLatest (2025): $8,904 · +2.2% YoY. Source: county tax records.
Cash-flow waterfall
monthlySold comps — $/sqft
last 12 mo · ≤1 miLoading sold comps…