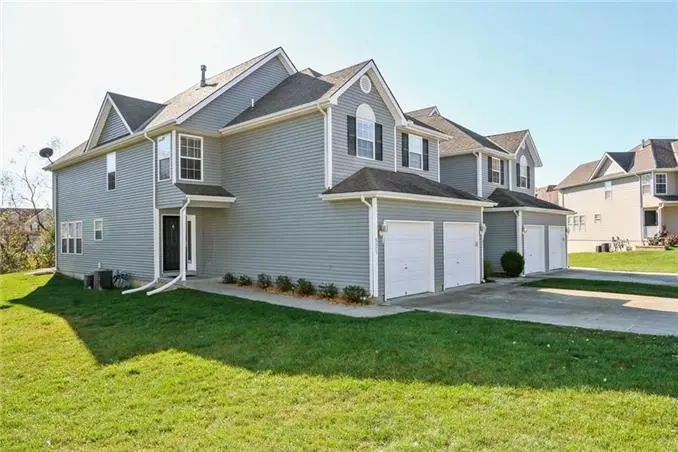
8673 NE 97th Ter
Kansas City, MO 64157
$270,000D+
3 bd · 2.0 ba ·
1,520 sqft ·
Built 2004
· Townhouse
· Pending
· 1 DOM
Cashflow @ list (25.0% down · 7.5%)
Estimated rent
$2,689/mo
Mortgage (P&I)
−$1,416
Tax + insurance
−$361
HOA
−$15
Vac / Maint / Mgmt
−$565
Net cashflow
$332/mo
Annual
$3,987/yr
Cap rate
7.77%
Cash-on-cash
5.27%
DSCR
1.23
1% rule
1.00%
Cash to close
$75,600
Investor read
- This is a 3-bed/2.0-bath townhouse listed at $270k.
- At list price, monthly cash flow is $332 ($4k/yr) — positive.
- The deal already cash-flows at list — no discount required.
- To meet the 1% rule (rent ≥ 1% of price), the offer needs to be $269k (0.4% below list).
- Only 1 days on market — expect competitive offers; lowballing is unlikely to land.
- Recommended offer: $269k (0.4% below list) — sets the bar for 1% rule.
- Local home prices are declining (-3.0%/yr); year-one equity from $2k of loan paydown is wiped out by about $8k of value loss. Plan a longer hold.
- Location reads 78/100 on livability (#28 in MO, #2,671 nationally) — a middle-class / working-renter tenant base. Strengths: amenities A+, commute A+, cost of living A+; Watch: crime F.
- Liberty 53 (suburban): math 41% / reading 59% proficiency, ranked #24 of 324 in MO (top 7%) — acceptable for families but not a draw, mixed tenant base, ~2y average lease; only 15% free/reduced lunch — higher-income household profile.
- Zoned schools: Shoal Creek Elem. (math 63% / reading 68%, grade B+, #63 of 1,115 statewide, top 6%, 883 students, 8% FRL); Liberty North High School (math 25% / reading 75%, grade D+, #116 of 521 statewide, top 22%, 2,326 students, 18% FRL) — zoned schools at 13% FRL track the district average.
- Market conditions: Rents rising fast (+9.5%/yr); 240 active listings in the ZIP; high-income renter base; 341 units permitted in Clay County in 2024 (40 in 5+ unit buildings).
- Clay County population projected at +24% by 2050 — long-run rental-demand tailwind backs the buy-and-hold thesis.
- 3 sale attempts since 23y ago with the ask held roughly flat each time — persistent listings suggest the price (not the market) is what's stuck; bring a comps-based counter.
- At projected returns (-3.0% appreciation + 8.0% rent growth), your $76k cash investment doubles in ~9 years — after that, you're playing with house money.
- Cap rate 7.8% vs local median 3.9% in Kansas City — top-decile yield for the area; either an underpriced asset or a hidden risk that comps aren't pricing in. Stress-test before assuming the spread holds.
Questions for listing agent
- What does the HOA fee cover, when was the last increase, and are there any pending special assessments or reserve-fund shortfalls?
- Is there a deadline driving the sale (1031 exchange, divorce, estate, relocation)? That informs how much negotiation room exists.
- Crime grade is F in this area — have there been break-ins, vandalism, or insurance claims at this property in the last 3 years? What carrier currently insures it and at what premium?
- The area grade is low — what's the realistic commute time and amenity access for the typical tenant pool here? Any planned neighborhood developments (good or bad) we should know about?
- What's the average days-on-market for RENTAL listings here right now (not sales)? A rising rental-DOM trend means longer vacancies and softer asking-rent achievability than the comps imply.
- What's the recent tenant-quality profile in this submarket — average credit score on applications, eviction rate, late-payment / NSF rate, and stable-employment percentage? A property-management company in the area should have these aggregated.
- How much new for-sale + rental construction is in the pipeline within 1–3 miles? Heavy new supply typically softens prices + rents 12–24 months out; constrained supply supports both.
CashFlowRE · CFR-CSH7TC6T71C41M
· Data 1 week ago
cashflowre.app · 2026-05-29