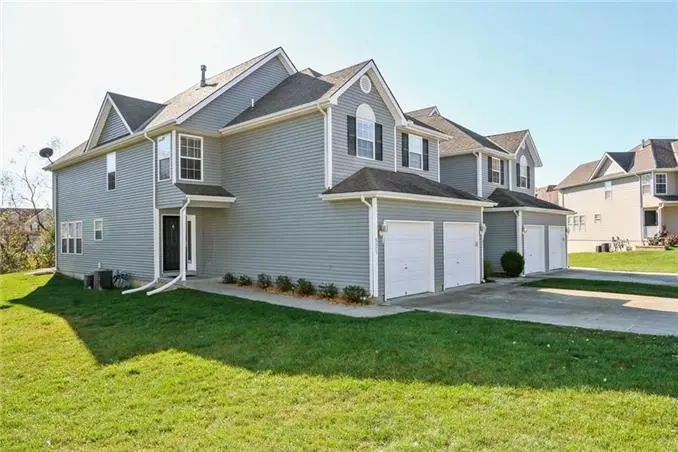
8673 NE 97th Ter · Kansas City, MO
Flood risk 1/10 · Minimal
- FEMA flood zone
- X (unshaded)
- Chance of flooding over 30 yrs
- 0.0%
- Est. flood insurance / yr
- $473 – $860
Fire risk 2/10 · Minimal
- Est. fire insurance / yr
- $1,054 – $1,958
Heat risk 4/10 · Minor
- Hot days now (above 106°F)
- 7 days/yr
- Hot days in 30 yrs
- 17 days/yr
Wind risk 2/10 · Minimal
- Chance of severe wind over 30 yrs
- —
Air-quality risk 3/10 · Minor
- Unhealthy air days now
- 3 days/yr
- Unhealthy air days in 30 yrs
- 4 days/yr
Risk factors via First Street. Map © Google.
Why this score? — see what drove the D+ grade
The composite is a weighted blend of 9 inputs, each scored 0–100. Each bar is that input's sub-score; the figure is the points it added to the 100-point composite (weight × sub-score).
- Cash flow +20.0/30.0
- DSCR +6.3/10.0
- 1% rule +5.0/10.0
- Rent growth +4.9/5.0
- Schools +4.5/10.0
- Livability +3.9/5.0
- ARV discount +2.5/15.0
- Condition / age +2.5/5.0
- Appreciation +0.0/10.0
$270,000
🖨 Deal sheet 📄 Offer letter ✓ Due diligence
Listing remarks MLS
Terrifically maintained 3 Bedroom end unit townhome w/ brand new carpeting throughout (Nov 2016), plus neutral color/décor! Kitchen w/ lots of cabinets, pantry, plus all appliances stay with the home. Open floor plan with corner fireplace in great room that walks out to private patio. Bedrooms 2 and 3 share their own full bath. Master BR bath with double vanity and walk in closet. Maintenance provided home provides snow removal, lawn care, all exterior maintenance, & includes sprinkler system. Ready for you today! $400.00 once a year HOA fee. The monthly HOA is 106.00.
Key facts
- $15 HOA
- Garage
- Community pool
Property features AI
Finance
- Other: Not in flood plain; Lot size approx. 1,742 square feet
- Financial info: Living area and specific financials not included
- HOA & community: HOA with annual fee ($175); Community pool; HOA covers building maintenance, lawn service, snow removal, maintenance-free exterior
Exterior
- Parking: Attached garage facing front (1 garage space)
- Security: Smoke detector(s)
- Utilities: Public water; Public sewer
- Home design: Attached townhouse; 2-story floor plan; Residential property
- Construction: Frame construction with vinyl siding; Composition roof; Full concrete basement
- Exterior features: Patio; Porch; Adjoins greenspace; City lot; Level yard; In-ground sprinkler system
Interior
- Kitchen: Dishwasher; Disposal; Microwave; Refrigerator; Electric range; Pantry
- Bedrooms: 3 bedrooms (all on second level)
- Flooring: Carpet; Vinyl in dining/kitchen areas
- Bathrooms: 3 full bathrooms; 1 half bathroom; Double vanity in a bathroom
- Heating & cooling: Heat pump with gas; Electric cooling
- Interior features: Ceiling fans; Pantry; Walk-in closets; Smoke detector(s)
- Laundry & utility: Laundry located on bedroom level
Neighborhood map
What this means for you Summary
Snapshot
- This is a 3-bed/2.0-bath townhouse listed at $270k.
Deal economics
- At list price, monthly cash flow is $332 ($4k/yr) — positive.
- The deal already cash-flows at list — no discount required.
- To meet the 1% rule (rent ≥ 1% of price), the offer needs to be $269k (0.4% below list).
- Recommended offer: $269k (0.4% below list) — sets the bar for 1% rule.
- Cap rate 7.8% vs local median 3.9% in Kansas City — top-decile yield for the area; either an underpriced asset or a hidden risk that comps aren't pricing in. Stress-test before assuming the spread holds.
Location & tenants
- Location reads 78/100 on livability (#28 in MO, #2,671 nationally) — a middle-class / working-renter tenant base. Strengths: amenities A+, commute A+, cost of living A+; Watch: crime F.
- Liberty 53 (suburban): math 41% / reading 59% proficiency, ranked #24 of 324 in MO (top 7%) — acceptable for families but not a draw, mixed tenant base, ~2y average lease; only 15% free/reduced lunch — higher-income household profile.
- Zoned schools: Shoal Creek Elem. (math 63% / reading 68%, grade B+, #63 of 1,115 statewide, top 6%, 883 students, 8% FRL); Liberty North High School (math 25% / reading 75%, grade D+, #116 of 521 statewide, top 22%, 2,326 students, 18% FRL) — zoned schools at 13% FRL track the district average.
- Market conditions: Rents rising fast (+9.5%/yr); 240 active listings in the ZIP; high-income renter base; 341 units permitted in Clay County in 2024 (40 in 5+ unit buildings).
Forward outlook
- Local home prices are declining (-3.0%/yr); year-one equity from $2k of loan paydown is wiped out by about $8k of value loss. Plan a longer hold.
- Clay County population projected at +24% by 2050 — long-run rental-demand tailwind backs the buy-and-hold thesis.
- At projected returns (-3.0% appreciation + 8.0% rent growth), your $76k cash investment doubles in ~9 years — after that, you're playing with house money.
Negotiation context
- Only 1 days on market — expect competitive offers; lowballing is unlikely to land.
- 3 sale attempts since 23y ago with the ask held roughly flat each time — persistent listings suggest the price (not the market) is what's stuck; bring a comps-based counter.
Questions for the listing agent
- What does the HOA fee cover, when was the last increase, and are there any pending special assessments or reserve-fund shortfalls?
- Is there a deadline driving the sale (1031 exchange, divorce, estate, relocation)? That informs how much negotiation room exists.
- Crime grade is F in this area — have there been break-ins, vandalism, or insurance claims at this property in the last 3 years? What carrier currently insures it and at what premium?
- The area grade is low — what's the realistic commute time and amenity access for the typical tenant pool here? Any planned neighborhood developments (good or bad) we should know about?
- What's the average days-on-market for RENTAL listings here right now (not sales)? A rising rental-DOM trend means longer vacancies and softer asking-rent achievability than the comps imply.
- What's the recent tenant-quality profile in this submarket — average credit score on applications, eviction rate, late-payment / NSF rate, and stable-employment percentage? A property-management company in the area should have these aggregated.
- How much new for-sale + rental construction is in the pipeline within 1–3 miles? Heavy new supply typically softens prices + rents 12–24 months out; constrained supply supports both.
Investment metrics
- 1% rule
- 1.00% ✗
- Cap rate
- 7.77%
- Cash-on-cash
- 5.27%
- DSCR
- 1.23
- GRM
- 8.4
CMA / ARV
- ARV (on-the-fly)
- $243,200
- Comps found
- 12
Show comp detail 12 sales within ~0.75 mi
| Address | Dist | Beds/Ba | Sqft | Sold | Price | $/sf | Match |
|---|---|---|---|---|---|---|---|
| 8633 NE 98th Ct | 0.06mi | 3/2.5 | 1,538 (+1%) | 3mo | $259,900 | $169 | 91 |
| 9831 N Lewis Ave | 0.15mi | 3/2.5 | 1,519 (-0%) | 4mo | $239,888 | $158 | 88 |
| 8654 NE 97th St | 0.05mi | 3/2.5 | 1,520 (0%) | 10mo | $265,000 | $174 | 88 |
| 8659 NE 97th Ter | 0.03mi | 3/2.5 | 1,498 (-1%) | 11mo | $255,000 | $170 | 85 |
| 8601 NE 97th St | 0.11mi | 3/2.5 | 1,517 (-0%) | 13mo | $235,000 | $155 | 82 |
| 8662 NE 97th Ter | 0.03mi | 3/2.5 | 1,607 (+6%) | 7mo | $250,000 | $156 | 81 |
| 8614 NE 98th Ct | 0.12mi | 2/2.5 (-1) | 1,451 (-4%) | 3mo | $229,900 | $158 | 77 |
| 8675 NE 97th St | 0.06mi | 3/2.5 | 1,607 (+6%) | 14mo | $255,000 | $159 | 74 |
| 8616 NE 97th St | 0.08mi | 3/2.5 | 1,607 (+6%) | 14mo | $257,000 | $160 | 73 |
| 8635 NE 97th St | 0.09mi | 3/2.5 | 1,607 (+6%) | 15mo | $245,000 | $152 | 72 |
| 9705 N Lewis Ave | 0.06mi | 2/2.5 (-1) | 1,451 (-4%) | 15mo | $237,500 | $164 | 70 |
| 9756 N Lewis Ave | 0.05mi | 2/2.5 (-1) | 1,451 (-4%) | 16mo | $245,000 | $169 | 69 |
Match score weights: distance 35% · size 25% · config 20% · recency 20%. Top-matched comps best support the ARV.
Projected returns pro-forma
-3.0% appreciation · 8.0% rent growth · sell at horizon
- IRR
- -2.8%
- Equity multiple
- 0.89×
- Total profit
- $-8,385
- Equity at exit
- $40,258
- IRR
- 11.6%
- Equity multiple
- 2.12×
- Total profit
- $84,607
- Equity at exit
- $23,345
Cash invested: $75,600 (down + closing). Projections, not guarantees.
Landlord ↔ Tenant lean methodology
- Overall (STATE)
- 81 Strongly Landlord-Friendly
- State Missouri
- 81 Strongly Landlord-Friendly · R+10
- County
- — inherits STATE
- City
- — inherits STATE
ZIP-level market 64157
- Home prices YoY
- -18.1%
- Rents YoY
- 9.5%
- Active inventory
- 240
- Price-to-rent
- 8.4×
Monthly cashflow live
- Estimated rent
- $2,689 medium interval (Pro) →
- Mortgage (P&I)
- −$1,416
- Tax from tax record
- −$249 /mo · $2,984/yr
- Insurance
- −$112
- HOA
- −$15
- Vacancy / Maint / Mgmt
- −$565
- Net cashflow
- $332
Break-even live
UW: 25.0% down · 7.5% · 30yr · 1.5% tax · 5.0% vac · 8.0% maint · 8.0% mgmt
Financing live
Cash to close
- Down payment
- $67,500
- Closing costs
- $8,100
- Reserves months
- —
- Total cash needed
- —
Loan-product check · same deal, 3 products live
Conventional
25% down · 7.5% · 30yr
- Down + closing
- —
- Monthly P&I
- —
- Monthly cashflow
- —
- DSCR
- —
- Eligible?
- —
Personal DTI + credit; lowest rate.
DSCR
20% down · 8.5% · 30yr
- Down + closing
- —
- Monthly P&I
- —
- Monthly cashflow
- —
- DSCR
- —
- Eligible?
- —
No personal income docs; deal must DSCR.
Hard money
10% down · 12.0% · 12mo
- Down + closing
- —
- Monthly P&I
- —
- Monthly cashflow
- —
- DSCR
- —
- Eligible?
- —
Short-term bridge; refi at stabilization.
HOA detail
- Monthly dues
- $15 · $180/yr
- Likely covers
- landscapingsnow removalexterior maint.
Listing history 1 events
-
2026-06-07$270,000 Pending 1 DOM
ⓘ Source: listings_history table (triggers on properties + properties_extension) + one-shot
backfill from property_details.listing_events for pre-trigger history.
Tax reassessment forecast MO · Resets to sale price
- Current annual tax
- $2,984 · $249/mo
- Projected year-2 tax
- $2,984 · $249/mo
- Expected delta
- $0/yr ($0/mo · 0.0%)
ⓘ Screening estimate from a state-policy table — verify with the county assessor before closing.
Climate risk First Street
- Flood 1/10 Low FEMA zone X (unshaded) · 0% chance over 30 yrs
- Wildfire 2/10 Low
- Heat 4/10 Moderate 7 d/yr ≥106°F today · 17 d/yr by 30 yrs out
- Wind 2/10 Low
- Air quality 3/10 Moderate 3 unhealthy d/yr today · 4 by 30 yrs out
Nearby sold comps map
Loading sold comps map…
Walkable amenities ~0.75 mi
Loading nearby amenities…
Taxation est. · year 1
- Rental income
- $32,268
- − Mortgage interest
- −$15,124
- − Property taxes
- −$2,984
- − Insurance
- −$1,350
- − Repairs & maintenance
- −$2,581
- − Management
- −$2,581
- − HOA
- −$180
- − Depreciation
- −$7,855
- Taxable loss
- −$387
- Est. tax savings @ 24.0%
- +$93
- After-tax cash flow
- $4,080/yr
For passive investors: Depreciation is non-cash, so a rental often shows a tax loss while cash-flowing — sheltering income. Rental losses are passive: they offset passive income freely, and up to $25,000/yr can offset ordinary (W-2) income if you actively participate and your MAGI is under $100k (phasing out to $0 by $150k); unused losses carry forward. On sale, claimed depreciation is recaptured at up to 25%, and gains may owe capital-gains tax (a 1031 exchange can defer both). Figures are a year-1 estimate at your 24.0% rate — not tax advice; consult a CPA.
Schools (NCES district)
- District
- Liberty 53
- NCES district ID
- 2918540
- Math proficiency
- 41% ▼ -9.00%
- Reading proficiency
- 59% ▼ -3.00%
- Median HH income
- $78,226
- Composite
- 45.41/100
- National rank
- #2624
- State rank
- #24 of 324 in MO
Livability — Kansas City
- Score
- 78/100
- State rank
- #28
- US rank
- #2671
Category grades
Schools grade is shown separately in the Schools card above.
Census & demographics
- Census place
- Kansas City, MO
- County
- Clay County · 220,651 people
- City population
- 439,467
- Metro
- Kansas City, MO-KS
- Population (ZIP)
- 23,030
- Household income
- $149,526
- Rent vs Own
- Severe rent burden
- 87.0
Population outlook (Clay County) Hauer SSP2
- Today (2025)
- 266,022 people
- By 2030
- 280,057 · +5.3%
- By 2040
- 306,153 · +15.1%
- By 2050
- 328,630 · +23.5%
- By 2075
- 375,182 · +41.0%
- By 2100
- 392,861 · +47.7%
Race, ethnicity, and origin ACS 2023
- Neighborhood character
- Predominantly White (82%)
- Race & ethnicity
- White 82% Asian 7% Two or more races 6% Hispanic / Latino 5% Black 3%
- Common ancestry
- Slovak 3% Italian 2% Lithuanian 2%
- Foreign-born
- 6% · Canada, Vietnam, China
- Languages at home
- 92% English-only · Spanish 3% Other Asian/Pacific 2% Vietnamese 1%
Political lean MEDSL · Clay
- 2024 margin
- Lean R (+5.6) · D 46.4% · R 52.0% · Other 1.6%
- 2008→2024 swing
- -4.9pp toward R · 2008: -0.7pp · 2024: -5.6pp
- All cycles
- 2024: R+5.6 2020: R+4.1 2016: R+11.1 2012: R+8.4 2008: R+0.7
Not yet ingested
- Civics
- —
Market trends
- HPI YoY
- ▼ -43.38%
- Current HPI
- 195.9921
- Rent YoY
- ▲ 9.50%
- Metro
- Kansas City, MO-KS
- State GDP YoY
- ▲ 1.84%
- F500 in state
- 20
Industry mix (Fortune 500 HQ in MO)
| Industry | F500 HQs | Revenue |
|---|---|---|
| Healthcare | 1 | $163B |
|
||
| Insurance | 1 | $21B |
|
||
| Industrial Technology | 1 | $17B |
|
||
| Retail | 1 | $16B |
|
||
| Industrial Distribution | 1 | $10B |
|
||
| Utilities | 1 | $9B |
|
||
Price history
+116.2% since first listed11 events — show timeline
- 2026-06-05 Pending — Heartland MLS as Distributed by MLS Grid
- 2026-05-27 Listed $270,000 Heartland MLS as Distributed by MLS Grid
- 2022-02-11 Price Changed $1,650 RENT.
- 2021-11-30 Sold (Public Records) — Public Records
- 2016-12-27 Sold (MLS) — Heartland MLS as Distributed by MLS Grid
- 2016-12-21 Sold (Public Records) — Public Records
- 2016-12-13 Pending — Heartland MLS as Distributed by MLS Grid
- 2016-11-23 Contingent — Heartland MLS as Distributed by MLS Grid
- 2016-11-16 Listed $132,900 Heartland MLS as Distributed by MLS Grid
- 2004-01-22 Sold (MLS) — Heartland MLS as Distributed by MLS Grid
- 2003-01-02 Listed $124,900 Heartland MLS as Distributed by MLS Grid
Property tax history
+3.2%/yrLatest (2025): $2,984 · +8.8% YoY. Source: county tax records.
Cash-flow waterfall
monthlySold comps — $/sqft
last 12 mo · ≤1 miLoading sold comps…