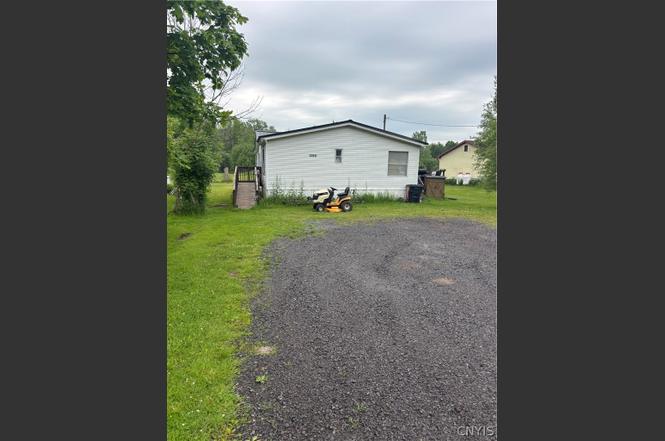
209 County Route 1a
Oswego, NY 13126
$149,900B-
3 bd · 2.0 ba ·
1,344 sqft ·
Built 2010
· Manufactured
· Active
· 8 DOM
Cashflow @ list (25.0% down · 7.5%)
Estimated rent
$1,854/mo
Mortgage (P&I)
−$786
Tax + insurance
−$705
HOA
−$0
Vac / Maint / Mgmt
−$389
Net cashflow
$-27/mo
Annual
$-325/yr
Cap rate
9.49%
Cash-on-cash
11.42%
DSCR
1.51
1% rule
1.24%
Cash to close
$41,972
Investor read
- This is a 3-bed/2.0-bath manufactured listed at $150k.
- At list price, monthly cash flow is $-27 ($-325/yr) — negative.
- To cash-flow at today's rent, offer at most $145k (3.2% below list).
- Meets the 1% rule at list price ($2k rent vs $150k).
- Only 8 days on market — expect competitive offers; lowballing is unlikely to land.
- Recommended offer: $145k (3.2% below list) — sets the bar for cash-flow.
- Local home prices are declining (-2.2%/yr); year-one equity from $1k of loan paydown is wiped out by about $3k of value loss. Plan a longer hold.
- Location reads 75/100 on livability (#265 in NY, #4,189 nationally) — a middle-class / working-renter tenant base. Strengths: cost of living A+, housing A+, health & safety A+; Watch: schools D+, crime F, commute F.
- Oswego City School District (town): math 39% / reading 51% proficiency, ranked #465 of 590 in NY (top 79%) — families likely to look elsewhere, expect single-tenant / working-renter base with shorter leases.
- Watch-outs: flood insurance adds $427/mo.
- Market conditions: Rents rising fast (+19.2%/yr); 168 active listings in the ZIP; 172 units permitted in Oswego County in 2024 (27 in 5+ unit buildings).
- Oswego County population projected at -23% by 2050 — secular population decline; favor cash flow + early exit over multi-decade hold.
- 3 sale attempts since 7y ago with the ask held roughly flat each time — persistent listings suggest the price (not the market) is what's stuck; bring a comps-based counter.
- At projected returns (-2.2% appreciation + 8.0% rent growth), your $42k cash investment doubles in ~10 years — after that, you're playing with house money.
- Climate carrying-cost: in FEMA flood zone AE (mandatory federal flood insurance) — expect insurance premiums to compound above CPI over the hold.
- This rent runs 34% of the median local income ($65k/yr) — at the standard rent-burdened threshold; future hikes will face affordability resistance.
Questions for listing agent
- What do current leases actually rent for vs. the listed asking? Can we see a recent rent roll and the last 12 months of T-12 income?
- What's the actual annual flood-insurance premium (NFIP or private), and is the property in a SFHA with mandatory coverage?
- Is there a deadline driving the sale (1031 exchange, divorce, estate, relocation)? That informs how much negotiation room exists.
- Schools are D-rated, which usually means shorter tenancies and higher turnover. Who's the typical renter profile here, and what's been the actual vacancy rate?
- Crime grade is F in this area — have there been break-ins, vandalism, or insurance claims at this property in the last 3 years? What carrier currently insures it and at what premium?
- What's the average days-on-market for RENTAL listings here right now (not sales)? A rising rental-DOM trend means longer vacancies and softer asking-rent achievability than the comps imply.
- What's the recent tenant-quality profile in this submarket — average credit score on applications, eviction rate, late-payment / NSF rate, and stable-employment percentage? A property-management company in the area should have these aggregated.
- How much new for-sale + rental construction is in the pipeline within 1–3 miles? Heavy new supply typically softens prices + rents 12–24 months out; constrained supply supports both.
CashFlowRE · CFR-CSRCFB6VBV8NW5
· Data 2 days ago
cashflowre.app · 2026-05-29