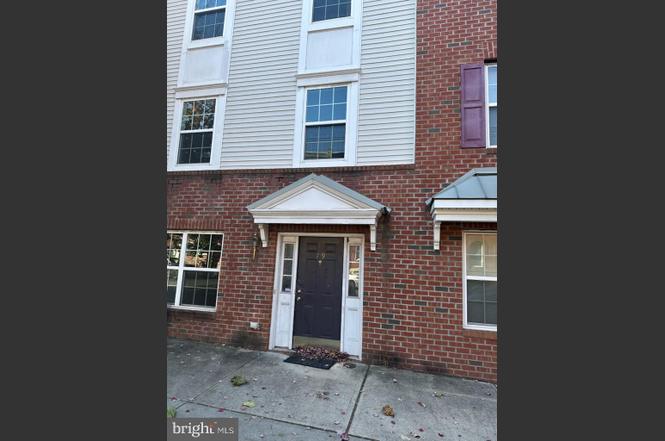
739 Centre St SW
Trenton, NJ 08611
$229,900C
3 bd · 2.5 ba ·
1,908 sqft ·
Built 2012
· Townhouse
· Active
· 188 DOM
Cashflow @ list (25.0% down · 7.5%)
Estimated rent
$2,441/mo
Mortgage (P&I)
−$1,206
Tax + insurance
−$383
HOA
−$2
Vac / Maint / Mgmt
−$513
Net cashflow
$337/mo
Annual
$4,048/yr
Cap rate
8.05%
Cash-on-cash
6.29%
DSCR
1.28
1% rule
1.06%
Cash to close
$64,372
Investor read
- This is a 3-bed/2.5-bath townhouse listed at $230k.
- At list price, monthly cash flow is $337 ($4k/yr) — positive.
- The deal already cash-flows at list — no discount required.
- Meets the 1% rule at list price ($2k rent vs $230k).
- It's been on market 188 days — a 12% lower offer ($202k) is reasonable based on typical stale-listing flexibility.
- Recommended offer: $202k (12.0% below list) — sets the bar for market timing.
- Local home prices are declining (-3.0%/yr); year-one equity from $2k of loan paydown is wiped out by about $7k of value loss. Plan a longer hold.
- Location reads 76/100 on livability (#133 in NJ, #3,533 nationally) — a middle-class / working-renter tenant base. Strengths: amenities A+, commute A+, health & safety A+; Watch: schools F, crime F, employment F.
- Trenton Public School District (urban): math 2% / reading 16% proficiency, ranked #471 of 472 in NJ (top 100%) — low school quality limits family demand, transient renter base, plan for 1-2y turnover; 80% free/reduced lunch — lower-income household profile, screen leases tightly.
- Market conditions: Rents rising fast (+4.7%/yr); 84 active listings in the ZIP; 15 comparable units currently listed for rent nearby; rentals at typical pace (median 21d on market — plan ~3-4 weeks tenant-placement turnaround); 2,256 units permitted in Mercer County in 2024 (1,303 in 5+ unit buildings).
- Mercer County population projected at +4% by 2050 — modest demand growth; plan on rents tracking national, not racing it.
- Climate carrying-cost: major wind risk, 27% chance of damaging wind over 30y; extreme-heat days projected 7→15/yr by 2055 (HVAC capex compounding) — expect insurance premiums to compound above CPI over the hold.
- Cap rate 8.1% vs local median 6.3% in Trenton — meaningfully above typical; check what's discounted (condition, days-on-market, listing class) to confirm the premium yield is real.
- At $2,441/mo this rent would consume 52% of the median local household income ($57k/yr) (locally 2147% of renters already pay >50% of income on rent) — very limited rent-growth headroom before tenants either downsize or default.
Questions for listing agent
- It's been on market 188 days. Have you received any prior offers? Is the seller open to a 12% concession, seller financing, or rate buy-down credit?
- What does the HOA fee cover, when was the last increase, and are there any pending special assessments or reserve-fund shortfalls?
- Why hasn't it sold? Are there any deal-killer items the seller is aware of (foundation, flood, title, zoning, code violations)?
- Is there a deadline driving the sale (1031 exchange, divorce, estate, relocation)? That informs how much negotiation room exists.
- Schools are F-rated, which usually means shorter tenancies and higher turnover. Who's the typical renter profile here, and what's been the actual vacancy rate?
- Crime grade is F in this area — have there been break-ins, vandalism, or insurance claims at this property in the last 3 years? What carrier currently insures it and at what premium?
- What's the average days-on-market for RENTAL listings here right now (not sales)? A rising rental-DOM trend means longer vacancies and softer asking-rent achievability than the comps imply.
- What's the recent tenant-quality profile in this submarket — average credit score on applications, eviction rate, late-payment / NSF rate, and stable-employment percentage? A property-management company in the area should have these aggregated.
CashFlowRE · CFR-CVNQY8FP7MNMDV
· Data 2 weeks ago
cashflowre.app · 2026-05-29