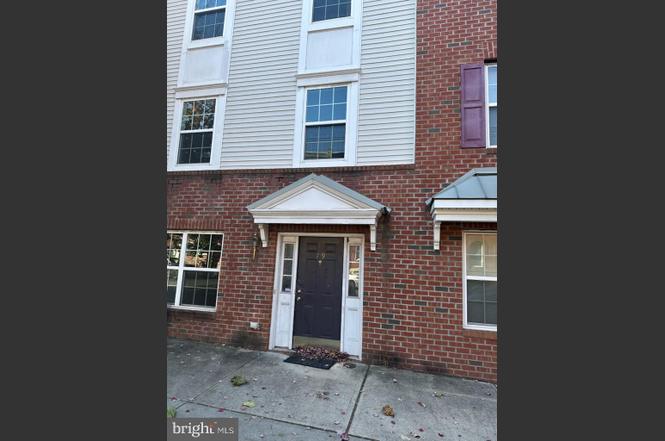
739 Centre St SW · Trenton, NJ
Flood risk 1/10 · Minimal
- FEMA flood zone
- X (unshaded)
- Chance of flooding over 30 yrs
- 0.0%
- Est. flood insurance / yr
- $507 – $1,088
Fire risk 1/10 · Minimal
- Est. fire insurance / yr
- $526 – $976
Heat risk 6/10 · Moderate
- Hot days now (above 102°F)
- 7 days/yr
- Hot days in 30 yrs
- 15 days/yr
Wind risk 6/10 · Moderate
- Chance of severe wind over 30 yrs
- 27.0%
Air-quality risk 5/10 · Moderate
- Unhealthy air days now
- 6 days/yr
- Unhealthy air days in 30 yrs
- 8 days/yr
Risk factors via First Street. Map © Google.
Why this score? — see what drove the C grade
The composite is a weighted blend of 9 inputs, each scored 0–100. Each bar is that input's sub-score; the figure is the points it added to the 100-point composite (weight × sub-score).
- Cash flow +21.3/30.0
- ARV discount +12.6/15.0
- DSCR +6.8/10.0
- 1% rule +5.6/10.0
- Livability +3.8/5.0
- Rent growth +3.7/5.0
- Condition / age +2.5/5.0
- Schools +0.7/10.0
- Appreciation +0.0/10.0
$229,900
🖨 Deal sheet 📄 Offer letter ✓ Due diligence
Listing remarks
HIGHEST AND BEST DUE FRIDAY AT 4:00 PM - Discover the affordable, spacious townhome community at the center of the area's most desirable destinations, K. Hovnanian's The Villages at Delaware Run! The Villages at Delaware Run features 84 beautifully appointed townhomes in 3 different home designs. The Trent model is a 3 bedroom, 2.5 bathrooms in a 3 level town home with 1,840 sq ft. This lovely unit has a spacious floor plan, 1 car parking, large kitchen, and features a park like setting throughout the community. ! This community is convenient to I-195, 95, the New Jersey Turnpike and is surrounded by exciting nightlife, shopping, dining, and parks, including Trenton Thunders Waterfront Park
Key facts
- Park like setting
- Convenient to i-195
- Townhome community
Tags
Property features AI
Finance
- Financial info: Lease not considered
- HOA & community: Monthly condo/HOA fee (listed as $1) with exterior building maintenance included; Association amenities: Other; Pets allowed on a case-by-case basis with number limits
Exterior
- Parking: Other parking type
- Utilities: Public water; Public sewer; Natural gas available; Electric service available
- Home design: Condominium interior townhouse/rowhouse; Unit spans 2 floors; Main entrance faces south; Building winterized
- Construction: Frame construction; Concrete perimeter foundation; R-factor exterior walls: 13
- Exterior features: Not in a federal flood zone; Other structures noted above and below grade; Tidal water: none
Interior
- Kitchen: Eat-in kitchen (appliances not listed)
- Bedrooms: One bedroom on main level; Two bedrooms on 1st lower level
- Bathrooms: Two full bathrooms total; One half bathroom total; One half bathroom on main level; Two full bathrooms on main level
- Heating & cooling: Central air conditioning; Baseboard electric heating; Natural gas heating and hot water
- Interior features: Eat-in kitchen; R-factor ceilings: 30 (attic/ceiling insulation value); 8 total rooms; Living Room, Dining Room, Family Room
- Laundry & utility: Laundry located on lower floor
Neighborhood map
What this means for you Summary
Snapshot
- This is a 3-bed/2.5-bath townhouse listed at $230k.
Deal economics
- At list price, monthly cash flow is $337 ($4k/yr) — positive.
- The deal already cash-flows at list — no discount required.
- Meets the 1% rule at list price ($2k rent vs $230k).
- Recommended offer: $202k (12.0% below list) — sets the bar for market timing.
- Cap rate 8.1% vs local median 6.3% in Trenton — meaningfully above typical; check what's discounted (condition, days-on-market, listing class) to confirm the premium yield is real.
Location & tenants
- Location reads 76/100 on livability (#133 in NJ, #3,533 nationally) — a middle-class / working-renter tenant base. Strengths: amenities A+, commute A+, health & safety A+; Watch: schools F, crime F, employment F.
- Trenton Public School District (urban): math 2% / reading 16% proficiency, ranked #471 of 472 in NJ (top 100%) — low school quality limits family demand, transient renter base, plan for 1-2y turnover; 80% free/reduced lunch — lower-income household profile, screen leases tightly.
- Market conditions: Rents rising fast (+4.7%/yr); 84 active listings in the ZIP; 15 comparable units currently listed for rent nearby; rentals at typical pace (median 21d on market — plan ~3-4 weeks tenant-placement turnaround); 2,256 units permitted in Mercer County in 2024 (1,303 in 5+ unit buildings).
- At $2,441/mo this rent would consume 52% of the median local household income ($57k/yr) (locally 2147% of renters already pay >50% of income on rent) — very limited rent-growth headroom before tenants either downsize or default.
Forward outlook
- Local home prices are declining (-3.0%/yr); year-one equity from $2k of loan paydown is wiped out by about $7k of value loss. Plan a longer hold.
- Mercer County population projected at +4% by 2050 — modest demand growth; plan on rents tracking national, not racing it.
Negotiation context
- It's been on market 188 days — a 12% lower offer ($202k) is reasonable based on typical stale-listing flexibility.
Risks & watch-outs
- Climate carrying-cost: major wind risk, 27% chance of damaging wind over 30y; extreme-heat days projected 7→15/yr by 2055 (HVAC capex compounding) — expect insurance premiums to compound above CPI over the hold.
Questions for the listing agent
- It's been on market 188 days. Have you received any prior offers? Is the seller open to a 12% concession, seller financing, or rate buy-down credit?
- What does the HOA fee cover, when was the last increase, and are there any pending special assessments or reserve-fund shortfalls?
- Why hasn't it sold? Are there any deal-killer items the seller is aware of (foundation, flood, title, zoning, code violations)?
- Is there a deadline driving the sale (1031 exchange, divorce, estate, relocation)? That informs how much negotiation room exists.
- Schools are F-rated, which usually means shorter tenancies and higher turnover. Who's the typical renter profile here, and what's been the actual vacancy rate?
- Crime grade is F in this area — have there been break-ins, vandalism, or insurance claims at this property in the last 3 years? What carrier currently insures it and at what premium?
- What's the average days-on-market for RENTAL listings here right now (not sales)? A rising rental-DOM trend means longer vacancies and softer asking-rent achievability than the comps imply.
- What's the recent tenant-quality profile in this submarket — average credit score on applications, eviction rate, late-payment / NSF rate, and stable-employment percentage? A property-management company in the area should have these aggregated.
- How much new for-sale + rental construction is in the pipeline within 1–3 miles? Heavy new supply typically softens prices + rents 12–24 months out; constrained supply supports both.
Investment metrics
- 1% rule
- 1.06% ✓
- Cap rate
- 8.05%
- Cash-on-cash
- 6.29%
- DSCR
- 1.28
- GRM
- 7.8
CMA / ARV
- ARV (on-the-fly)
- $259,488
- Comps found
- 10
Show comp detail 10 sales within ~0.75 mi
| Address | Dist | Beds/Ba | Sqft | Sold | Price | $/sf | Match |
|---|---|---|---|---|---|---|---|
| 739 Centre St SW | 0.00mi | 3/2.5 | 1,908 (0%) | 1mo | $225,000 | $118 | 99 |
| 17 Cliff St | 0.07mi | 3/2.5 | 1,908 (0%) | 12mo | $245,000 | $128 | 86 |
| 15 Cliff St | 0.07mi | 3/2.5 | 1,908 (0%) | 16mo | $285,000 | $149 | 83 |
| 703 Center St | 0.07mi | 3/2.5 | 1,908 (0%) | 17mo | $260,000 | $136 | 82 |
| 13 Cliff St | 0.08mi | 3/2.5 | 1,908 (0%) | 20mo | $220,000 | $115 | 80 |
| 727 Centre St | 0.02mi | 3/3.0 | 1,840 (-4%) | 23mo | $210,000 | $114 | 72 |
| 1244 S Pennsylvania Ave | 0.66mi | 3/3.0 | 1,920 (+1%) | 15mo | $285,000 | $148 | 54 |
| 22B Steel St | 0.74mi | 3/2.5 | 1,932 (+1%) | 20mo | $285,000 | $148 | 47 |
| 445 Genesee St | 0.74mi | 3/2.0 | 1,638 (-14%) | 2mo | $230,000 | $140 | 38 |
| 820 Lamberton St | 0.44mi | 2/1.0 (-1) | 1,632 (-14%) | 20mo | $160,000 | $98 | 27 |
Match score weights: distance 35% · size 25% · config 20% · recency 20%. Top-matched comps best support the ARV.
Projected returns pro-forma
-3.0% appreciation · 4.71% rent growth · sell at horizon
- IRR
- -4.7%
- Equity multiple
- 0.82×
- Total profit
- $-11,458
- Equity at exit
- $34,279
- IRR
- 6.9%
- Equity multiple
- 1.56×
- Total profit
- $35,993
- Equity at exit
- $19,878
Cash invested: $64,372 (down + closing). Projections, not guarantees.
Landlord ↔ Tenant lean methodology
- Overall (STATE)
- 21 Tenant-Leaning
- State New Jersey
- 21 Tenant-Leaning · D+6
- County
- — inherits STATE
- City
- — inherits STATE
ZIP-level market 08611
- Rents YoY
- 4.7%
- Active inventory
- 84
- Price-to-rent
- 7.8×
Monthly cashflow live
- Estimated rent
- $2,441 high interval (Pro) →
- Mortgage (P&I)
- −$1,206
- Tax est. 1.5%
- −$287 /mo · $3,448/yr
- Insurance
- −$96
- HOA
- −$2
- Vacancy / Maint / Mgmt
- −$513
- Net cashflow
- $337
Break-even live
UW: 25.0% down · 7.5% · 30yr · 1.5% tax · 5.0% vac · 8.0% maint · 8.0% mgmt
Financing live
Cash to close
- Down payment
- $57,475
- Closing costs
- $6,897
- Reserves months
- —
- Total cash needed
- —
Loan-product check · same deal, 3 products live
Conventional
25% down · 7.5% · 30yr
- Down + closing
- —
- Monthly P&I
- —
- Monthly cashflow
- —
- DSCR
- —
- Eligible?
- —
Personal DTI + credit; lowest rate.
DSCR
20% down · 8.5% · 30yr
- Down + closing
- —
- Monthly P&I
- —
- Monthly cashflow
- —
- DSCR
- —
- Eligible?
- —
No personal income docs; deal must DSCR.
Hard money
10% down · 12.0% · 12mo
- Down + closing
- —
- Monthly P&I
- —
- Monthly cashflow
- —
- DSCR
- —
- Eligible?
- —
Short-term bridge; refi at stabilization.
Rent comps 15 comps
| Address | Beds | Baths | Sqft | Rent | $/sqft | DOM | Units | Dist |
|---|---|---|---|---|---|---|---|---|
| 5 Rafting Way Trenton, NJ | 3.0 | 2.5 | 1908 | $2,550 | $1.34 | 43d | 1 | 0.03mi |
| 244 Jersey St Trenton, NJ | 3.0 | 1.5 | 1368 | $2,300 | $1.68 | 13d | 1 | 0.37mi |
| 203 Genesee St Unit 2 Trenton, NJ | 2.0 | 1.0 | 1452 | $1,700 | $1.17 | 21d | 1 | 0.71mi |
| 233 Virginia Ave Trenton, NJ | 3.0 | 1.0 | 1302 | $2,500 | $1.92 | 12d | 1 | 0.72mi |
| 1103 Division St Trenton, NJ | 4.0 | 1.0 | 1296 | $2,000 | $1.54 | 21d | 1 | 0.79mi |
| 1023 Chestnut Ave Unit B Trenton, NJ | 2.0 | 1.0 | 2070 | $1,700 | $0.82 | 13d | 1 | 0.84mi |
| 1049 Genesee St Trenton, NJ | 3.0 | 1.0 | 1270 | $2,300 | $1.81 | 21d | 1 | 1.02mi |
| 250 Washington St Morrisville, PA | 2.0 | 1.0 | 2371 | $1,750 | $0.74 | 44d | 1 | 1.03mi |
| 1078 Lalor St Unit 1 Trenton, NJ | 2.0 | 1.0 | 1488 | $1,895 | $1.27 | 21d | 1 | 1.09mi |
| 1078 Lalor St Unit 2 Trenton, NJ | 2.0 | 1.0 | 1488 | $1,785 | $1.20 | 21d | 1 | 1.09mi |
| 234 Howell St Trenton, NJ | 3.0 | 3.0 | 1656 | $3,600 | $2.17 | 21d | 1 | 1.18mi |
| 117 Park Ave Morrisville, PA | 3.0 | 2.0 | 1396 | $3,200 | $2.29 | 12d | 1 | 1.27mi |
| 130 Harper Ave Morrisville, PA | 3.0 | 2.5 | 1276 | $3,500 | $2.74 | 12d | 1 | 1.33mi |
| 432 W Bridge St Morrisville, PA | 2.0 | 1.0 | 1853 | $2,000 | $1.08 | 43d | 1 | 1.39mi |
| 635 Chambers St Trenton, NJ | 4.0 | 2.0 | 1312 | $2,500 | $1.91 | 13d | 1 | 1.41mi |
HOA detail
- Monthly dues
- $2 · $24/yr
- Likely covers
- water
Listing history 5 events
-
2026-05-31days on market $229,900 Active 188 DOM
-
2026-05-30days on market $229,900 Active 187 DOM
-
2026-03-04price $229,900
-
2026-03-04price $229,000
-
2025-11-24$239,900 Active
ⓘ Source: listings_history table (triggers on properties + properties_extension) + one-shot
backfill from property_details.listing_events for pre-trigger history.
Climate risk First Street
- Flood 1/10 Low FEMA zone X (unshaded) · 0% chance over 30 yrs
- Wildfire 1/10 Low
- Heat 6/10 Major 7 d/yr ≥102°F today · 15 d/yr by 30 yrs out
- Wind 6/10 Major 27% chance of damaging wind over 30 yrs
- Air quality 5/10 Major 6 unhealthy d/yr today · 8 by 30 yrs out
Nearby sold comps map
Loading sold comps map…
Walkable amenities ~0.75 mi
Loading nearby amenities…
Taxation est. · year 1
- Rental income
- $29,288
- − Mortgage interest
- −$12,878
- − Property taxes
- −$3,448
- − Insurance
- −$1,150
- − Repairs & maintenance
- −$2,343
- − Management
- −$2,343
- − HOA
- −$24
- − Depreciation
- −$6,688
- Taxable income
- $414
- Est. tax owed @ 24.0%
- −$99
- After-tax cash flow
- $3,949/yr
For passive investors: Depreciation is non-cash, so a rental often shows a tax loss while cash-flowing — sheltering income. Rental losses are passive: they offset passive income freely, and up to $25,000/yr can offset ordinary (W-2) income if you actively participate and your MAGI is under $100k (phasing out to $0 by $150k); unused losses carry forward. On sale, claimed depreciation is recaptured at up to 25%, and gains may owe capital-gains tax (a 1031 exchange can defer both). Figures are a year-1 estimate at your 24.0% rate — not tax advice; consult a CPA.
Schools (NCES district)
- District
- Trenton Public School District
- NCES district ID
- 3416290
- Math proficiency
- 2% ▼ -8.00%
- Reading proficiency
- 16% ▼ -4.00%
- Median HH income
- $35,078
- Composite
- 7.31/100
- National rank
- #9956
- State rank
- #471 of 472 in NJ
Livability — Trenton
- Score
- 76/100
- State rank
- #133
- US rank
- #3533
Category grades
Schools grade is shown separately in the Schools card above.
Census & demographics
- Census place
- Trenton, NJ
- County
- Mercer County · 327,655 people
- City population
- 177,819
- Metro
- Trenton-Princeton, NJ
- Population (ZIP)
- 31,995
- Household income
- $56,788
- Rent vs Own
- Severe rent burden
- 2147.0
Population outlook (Mercer County) Hauer SSP2
- Today (2025)
- 381,395 people
- By 2030
- 384,640 · +0.9%
- By 2040
- 391,431 · +2.6%
- By 2050
- 397,845 · +4.3%
- By 2075
- 417,281 · +9.4%
- By 2100
- 420,327 · +10.2%
Race, ethnicity, and origin ACS 2023
- Neighborhood character
- Diverse neighborhood (Simpson 0.56)
- Race & ethnicity
- Hispanic / Latino 62% Black 20% Two or more races 18% White 14% Native American 4%
- Hispanic origin (detail)
- Mexican 2% Puerto Rican 12% Dominican 8%
- Common ancestry
- Romanian 2% Swiss 1% Hispanic 1%
- Foreign-born
- 37% · Canada, Jamaica, Guatemala
- Languages at home
- 41% English-only · Spanish 57% French/Haitian/Cajun 2%
Political lean MEDSL · Mercer
- 2024 margin
- Solid D (+33.9) · D 65.9% · R 32.0% · Other 2.1%
- 2008→2024 swing
- -2.2pp toward R · 2008: 36.1pp · 2024: 33.9pp
- All cycles
- 2024: D+33.9 2020: D+40.0 2016: D+36.2 2012: D+36.8 2008: D+36.1
Not yet ingested
- Civics
- —
Market trends
- HPI YoY
- ▼ -267.62%
- Current HPI
- 276.5427
- Rent YoY
- ▲ 4.71%
- Metro
- Trenton-Princeton, NJ
- State GDP YoY
- ▲ 2.05%
- F500 in state
- 34
Industry mix (Fortune 500 HQ in NJ)
| Industry | F500 HQs | Revenue |
|---|---|---|
| Consumer Goods | 3 | $31B |
|
||
| Pharmaceuticals | 2 | $153B |
|
||
| Technology | 2 | $21B |
|
||
| Insurance | 2 | $20B |
|
||
| Healthcare | 2 | $19B |
|
||
| Financial Services | 1 | $70B |
|
||
Price history
-4.2% since first listed3 events — show timeline
- 2026-03-04 Price Changed $229,900 BRIGHT MLS
- 2026-03-04 Price Changed $229,000 BRIGHT MLS
- 2025-11-24 Listed $239,900 BRIGHT MLS
Cash-flow waterfall
monthlySold comps — $/sqft
last 12 mo · ≤1 miLoading sold comps…