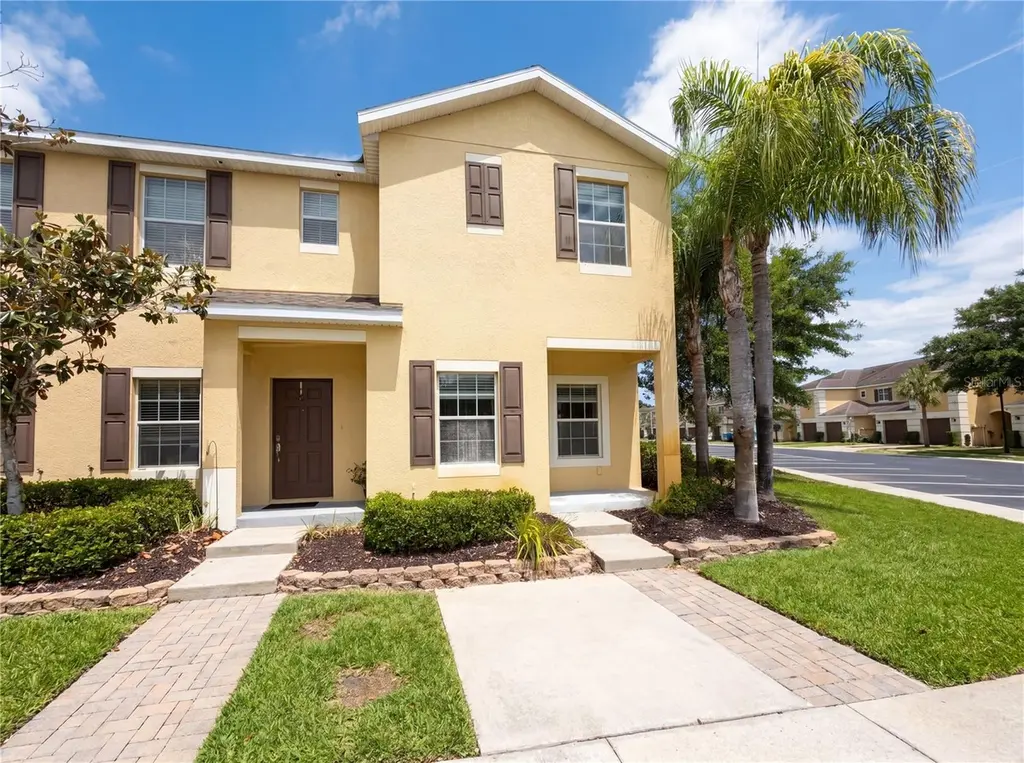
8548 Gablebend Way
Tampa, FL 33647
$197,000D
2 bd · 3.0 ba ·
1,192 sqft ·
Built 2012
· Townhouse
· Pending
· 26 DOM
Cashflow @ list (25.0% down · 7.5%)
Estimated rent
$1,863/mo
Mortgage (P&I)
−$1,033
Tax + insurance
−$419
HOA
−$266
Vac / Maint / Mgmt
−$391
Net cashflow
$-247/mo
Annual
$-2,962/yr
Cap rate
4.79%
Cash-on-cash
-5.37%
DSCR
0.76
1% rule
0.95%
Cash to close
$55,160
Investor read
- This is a 2-bed/3.0-bath townhouse listed at $197k.
- At list price, monthly cash flow is $-247 ($-3k/yr) — negative.
- To cash-flow at today's rent, offer at most $153k (22.1% below list).
- To meet the 1% rule (rent ≥ 1% of price), the offer needs to be $186k (5.4% below list).
- It's been on market 26 days — a 2% lower offer ($194k) is reasonable based on typical stale-listing flexibility.
- Recommended offer: $153k (22.1% below list) — sets the bar for cash-flow.
- Local home prices are declining (-3.0%/yr); year-one equity from $1k of loan paydown is wiped out by about $6k of value loss. Plan a longer hold.
- Location reads 79/100 on livability (#142 in FL, #2,135 nationally) — a middle-class / working-renter tenant base. Strengths: commute A+, housing A+, health & safety A+; Watch: crime D+.
- Hillsborough (suburban): math 47% / reading 50% proficiency, ranked #41 of 73 in FL (top 56%) — families likely to look elsewhere, expect single-tenant / working-renter base with shorter leases.
- Zoned schools: Turner-Bartels K-8 School (math 45% / reading 54%, grade D, #1,088 of 2,144 statewide, top 53%, 1,442 students, 43% FRL); Wharton High School (math 33% / reading 42%, grade F, #336 of 667 statewide, top 51%, 2,289 students, 46% FRL).
- Market conditions: Rents soft (-1.2%/yr); 493 active listings in the ZIP; 11 comparable units currently listed for rent nearby; rentals at typical pace (median 24d on market — plan ~3-4 weeks tenant-placement turnaround); solid renter incomes; 9,053 units permitted in Hillsborough County in 2024 (4,555 in 5+ unit buildings).
- Hillsborough County population projected at +37% by 2050 — long-run rental-demand tailwind backs the buy-and-hold thesis.
- 5 sale attempts with the ask held roughly flat each time — persistent listings suggest the price (not the market) is what's stuck; bring a comps-based counter.
- Climate carrying-cost: severe wind risk, 99% chance of damaging wind over 30y; extreme-heat days projected 7→27/yr by 2055 (HVAC capex compounding) — expect insurance premiums to compound above CPI over the hold.
Questions for listing agent
- What do current leases actually rent for vs. the listed asking? Can we see a recent rent roll and the last 12 months of T-12 income?
- What does the HOA fee cover, when was the last increase, and are there any pending special assessments or reserve-fund shortfalls?
- Is there a deadline driving the sale (1031 exchange, divorce, estate, relocation)? That informs how much negotiation room exists.
- Crime grade is D in this area — have there been break-ins, vandalism, or insurance claims at this property in the last 3 years? What carrier currently insures it and at what premium?
- The area grade is low — what's the realistic commute time and amenity access for the typical tenant pool here? Any planned neighborhood developments (good or bad) we should know about?
- What's the average days-on-market for RENTAL listings here right now (not sales)? A rising rental-DOM trend means longer vacancies and softer asking-rent achievability than the comps imply.
- What's the recent tenant-quality profile in this submarket — average credit score on applications, eviction rate, late-payment / NSF rate, and stable-employment percentage? A property-management company in the area should have these aggregated.
- How much new for-sale + rental construction is in the pipeline within 1–3 miles? Heavy new supply typically softens prices + rents 12–24 months out; constrained supply supports both.
CashFlowRE · CFR-CW5Z8F6XRRKSTV
· Data 2 weeks ago
cashflowre.app · 2026-05-29